Acquisition of Meniscus by Metasphere
TOGETHER EMPOWERING UTILITIES TO ACHIEVE ZERO SPILLS
We are delighted that, as of the 7th April 2023, Meniscus are now a wholly owned subsidiary of Metasphere.

TOGETHER EMPOWERING UTILITIES TO ACHIEVE ZERO SPILLS
We are delighted that, as of the 7th April 2023, Meniscus are now a wholly owned subsidiary of Metasphere.
We have created a map showing the location and details of all consented discharges to rivers and groundwater for England. We are planning to extend this to both Wales and Scotland if we can obtain the consent data in a suitable format from Natural Resources Wales and SEPA.
The map shows all main UK rivers and the location of any consented discharge to both rivers and groundwater. Also included are the locations of all Combined Sewer Overflows (black icon) in England. For all consents (orange icon) where the discharge is to river, then we have added the expected location of the consented discharge into the river (blue icon at the end of a green line).
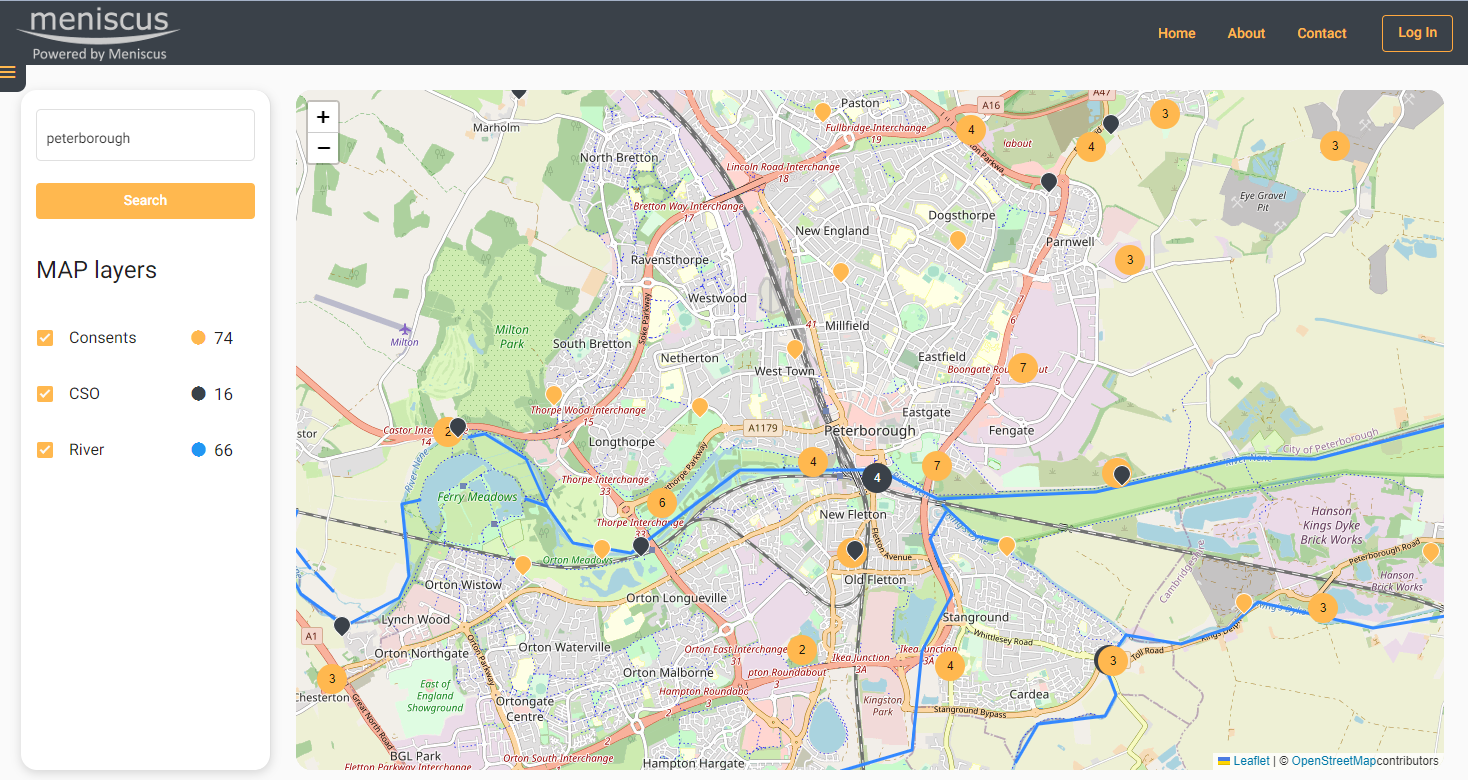
Consents to discharge near peterborough
The map will use your current location (subject to you granting access) to display relevant data. For access on a mobile phone then the area you can view is limited to ensure the site loads quickly. On a PC then you can access a larger area.
The idea for the site arose during the Big Rivers challenge at the Northumbrian Water Innovation festival. Meniscus were part of a team, including Meniscus, ESRI and NWL employees to develop a prototype app for Open Water swimmers to understand risk from pollution events. Whilst a lot of the data to deliver such an app is currently not available as a public dataset, we have created this dashboard as a first step to allow river users to identify discharges into rivers.
Please let us know if there is additional information that you would like us to try and include in the map. We cannot promise to make changes but we will always look to see what can be done.
Contact us at [email protected] or through our contact page
More information on MAP Rain click here
Our original MCE analytics engine has had a bit of a makeover! A new AngularJS webclient and updated Javascript widgets have revitalised the analytics engine. It is just as fast, just as flexible and just as easy to use. However, the new AngularJS dashboard makes it much easier to set up, configure and modify Items. The new Javascript widgets also make it easier to create your own dashboards and to display the metrics you need.
New MCE widgets update is now available. Makes it even easier to build and display your own analytics
Our new MCE widgets update is now available. This lets users build their own dashboard solutions. Using the widgets, you can build your own dashboards and select the way that you want to display your data. Key features in the new widgets include:
The MCE widgets build on the existing MCE low-code analytics platform and are designed to give users simple access to their data.
This is an example of an iframe built using the new Gauge widget code. Electricity values are updated every 6 seconds. The widget updates every 2 minutes.
For more information on MCE widgets
For more information on Meniscus Calculation Engine (MCE)
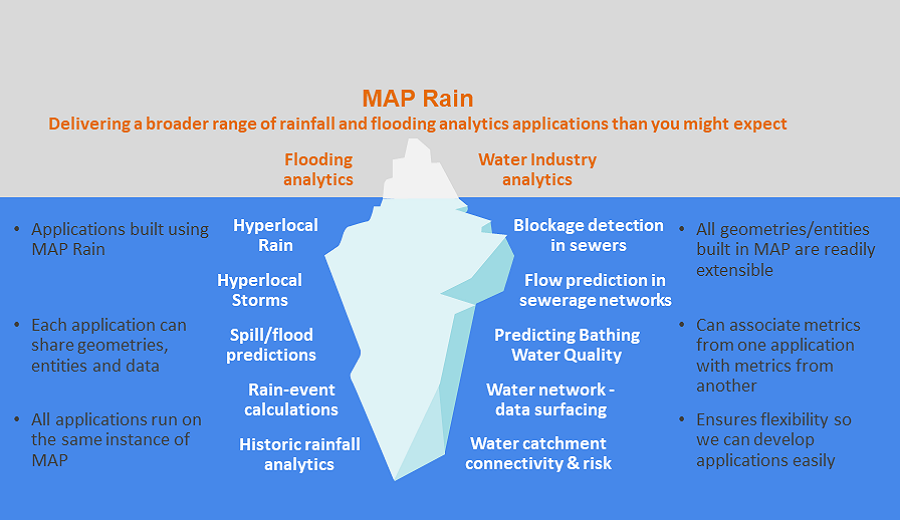
MAP Rain model infographic shows some of the analytics solutions built using the MAP Rain model
MAP Rain is a generic real-time model built using MAP for processing, primarily, radar and forecast rainfall data. The model delivers all the underlying process of fusing the historic, current, Hyperlocal (our own 1-hour forecast) and forecast rainfall data together for any area, resolution, or size of cutout (the area over which we process the rainfall data). Built into MAP Rain are lots of methods to re-sample, aggregate, extract and re-process the rainfall data. These ensure we have the flexibility to apply rainfall data to any point or polygon in the overall cutout area. All these methods are available as API calls.
We use MAP Rain to build a broad range of applications that have rainfall data at their heart. The number of such applications continues to rise and we can deliver all these applications to multiple customers on one instance of MAP.
More information on MAP Rain
These are the Hyperlocal Storms alerts (beta) identified around the UK for today. Using real-time radar rainfall we are tracking the path of areas of high-intensity rainfall and predicting their movement over the next hour, at 5-minute increments, using a machine learning algorithm. As these Hyperlocal Storms pass over any village, town or city we generate an alert. For customers interested in particular cities then we can create the alerts for any postcode sector in the city.
This is part of our MAP Rain service. For more information then click here.
We have created our own Hyperlocal Rainfall predictions for the past 5 years. Click here for more information and you can download the Hyperlocal Rainfall app on both the Google Playstore and the Apple App Store.
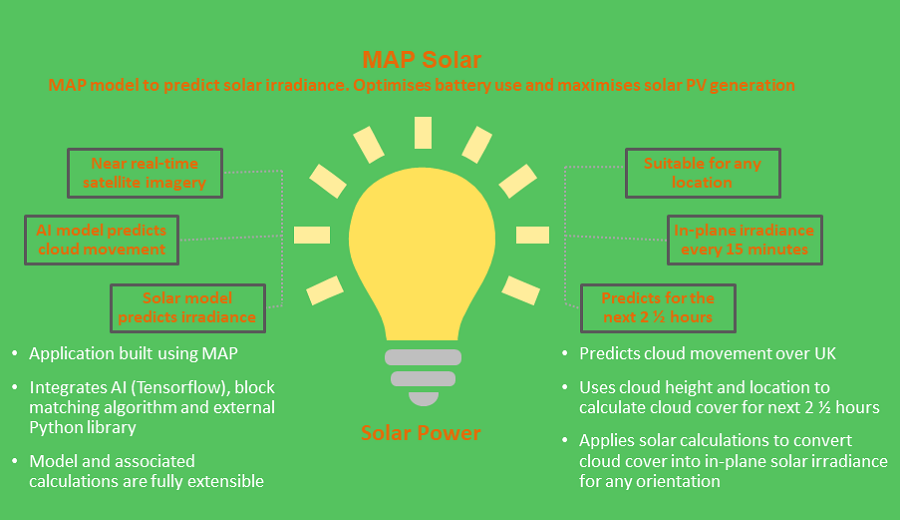
Overview of the solar model built with MAP to predict solar irradiance
The objective of the project was to provide a way to optimise the integration of battery storage and PV solar power. By predicting solar irradiance, and hence solar power from PV installations, gives solar plant operators the ability to maximise revenues by charging and discharging batteries at the optimum time.
The project integrates near real-time satellite imagery, AI and an external Python solar calculation library with the core MAP framework to deliver an innovative and accurate way to predict solar irradiance data.
Key Partners in the InnovateUK funded collaborative project
Open Energi
National Solar Centre
Cornwall Council
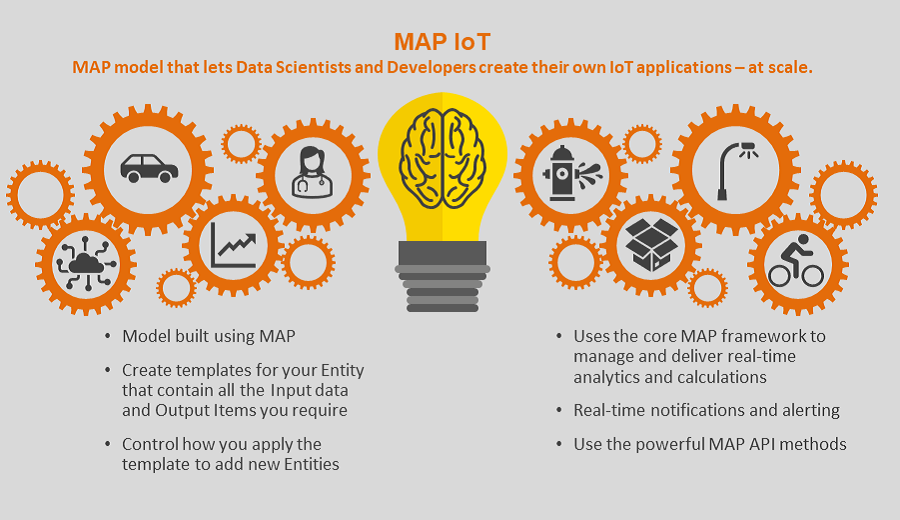
Overview of the MAP IoT Entity model used to build IoT applications
MAP IoT Entity model gives developers the ability to create their own Entities or Things in MAP. It makes use of the core MAP framework and integrated analytics stack to hide all the complexity of creating calculations, associations, alerts. More importantly, it does this at scale and in near real-time. This allows developers to focus on creating the underlying algorithms they want and in developing their dashboards/user interfaces. The MAP IoT Entity model takes a lot of the principles of the original low-code MCE Calculation Engine and applies them at scale – but you will need to be a developer to use MAP!
More information on the MAP IoT model
Hyperlocal Storm tracks high-intensity rainfall, in near real-time, and predicts the movement of the storm for the next hour at 5-minute intervals.
We then overlay this information with a map of all urban extents in the UK to identify ANY village/town that will be affected. For major urban areas, we are generating alerts at the postcode sector level.
This service will be of particular interest to Councils and Companies covering large rural areas or having large numbers of locations dotted around the country.
The image below shows an example of the urban extents and postcode sectors around the Leeds area.
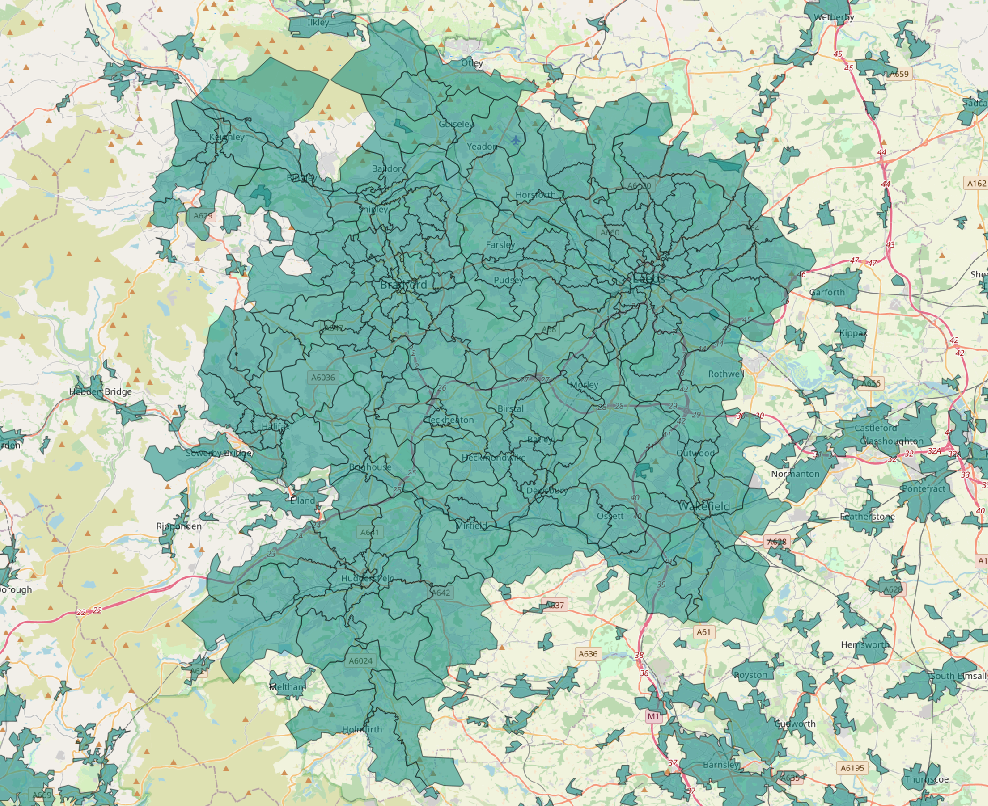
Example of urban extents around the Leeds area
At present, using our MAP Rain point or polygon alerts, we identify rain events happening over the next 30 hours using forecast data. But, we need to know the location of that point or polygon.
With Hyperlocal Storm, we can identify any area at risk, without having to set that area up beforehand. So, for large rural areas, like Lincolnshire, we can predict these storms for any urban area across the 20,000+ km2 council area.
We are finalising testing at the moment and trying to work out the best way to visualise this information and/or share it with partners. This is where we need some help. We are keen to understand how users might want to use this information and share it within their organisations or with residents.
More information on MAP Rain click here
Meniscus has been selected as one of the finalists to go through to the Scale Phase of the Gravity 02 Challenge – looking at creating micro-climate models
We are using our MAP IoT analytics platform to develop a solution to the Bardsley Orchard Challenge – how to calculate micro-climates to increase farm efficiency and productivity. Bridging the link between regional weather measures (and forecasts) and local microclimates – starting with agricultural orchard systems?
So, we are through the Accelerate phase of the challenge and now into scaling and developing the key principles behind the service. Have got a lot more work to do – but a really interesting project to work on and one that offers a lot of opportunities.
Thanks to Deloittes for organising the event and Bardsley Orchards for setting the challenge.
LinkedIn article on the Gravity 02 challenge