Solar irradiance predictions for the next 2 1/2 hours
Available in 15 minute time-steps and updated every 15 minutes
Overview
The growing demand for solar PV is having an impact on the low voltage (LV) network. New grid connections can be expensive and can affect a project’s viability. In some areas of the country Distribution Network Operators (DNOs) are forced to limit new solar sites. However, new technologies are introducing ways to make smarter use of the abundant free energy provided by the sun and deliver new revenue streams, without the need for costly infrastructure upgrades.
With the UK’s solar capacity forecast to rise to 15.7GW by 2020 – from just over 9.3GW at present – using advanced technology to more efficiently integrate and optimise solar PV sites is vital to create a more sustainable energy future.
Funded by InnovateUK, the UK Government’s Innovation Agency, MAP Solar delivers solar irradiance predictions in near-time with better accuracy. This allows PV sites to match generation to demand.
Improved modelling and optimisation
If solar irradiance predictions indicate solar generation will be higher than the export limit of the site, a battery can be charged instead of curtailing generation and then discharged to grid during a later period of high demand. In the meantime the battery can be employed for Demand Side Response (DSR) activities. For a site with no installed storage, generation can be curtailed at times when the network is constrained in response to DSR signals, such as Demand Turn-Up. Accurate solar irradiance predictions allow the DNO or Transmission System Operator (National Grid) to efficiently manage their network.
MAP Solar makes smarter use of solar PV via peer-to-peer energy markets that benefit local communities, delivering a smarter, more flexible energy system across the UK.
What is the technology behind the service?
How does it all work?
Satellite imagery
Near real time (NRT) satellite imagery from the SEVIRI instrument on the Meteosat Second Generation 0-degree satellite is used to create 1km2 gridded images of the solar reflectance. This includes visible and infra-red images as well as metadata on the estimated cloud height.
These NRT images are received and processed every 15 minutes on the production server and every 30 minutes on the development server and imported into the Meniscus Analytics Platform (MAP) .
AI and Block Matching
MAP Solar uses a Convolutional Long Short-term Memory (LSTM) recurrent neural network (NN) as the basis of the predictive model. This is run using the open source Tensorflow software library. The model is trained using the historical image data from the period and includes over 12,000 cloud images. The output from the LSTM is a set of predicted images at 15-minute intervals for the next 2 1/2 hours.
We also use a block matching and relaxation approach to enhance LSTM NN model during the first and last hour of each solar day. This method creates a speed and direction vector for every 16km2 cell of the images and these vectors are then applied to the last raw image to create a similar set of images which overwrite the LSTM images.
Clear Sky calculation for any location
MAP Solar uses the PVLIB Python open source tool for calculate the Clear Sky results for any particular location. This includes the direct , diffuse and total in-plane solar irradiance values. PVLIB provides a range of models and variables to help improve the model accuracy for the specific location.
These Clear Sky values are then modified to account for the cloud cover and the actual and forecast rainfall at the specific location. The model also takes in the cloud height and the time of data to ensure that the right part of the predicted images is used to make the cloud cover adjustment. The final output is a set of solar irradiance predictions at 15 minutes for the next 3 hours.
Why use solar irradiance predictions?
What benefits does this offer?
Relationship between solar irradiance predictions and site export power
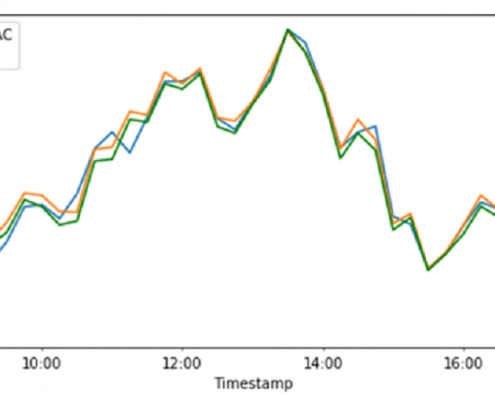
For the solar PV sites monitored in the project, the relationship between actual solar irradiance and actual inverter output power is very linear. A Random Forest Regression estimates inverter output power using 3 variables: In-plane solar irradiance, temperature and the invertor output power 30 minutes previously.
Comparing the actual inverter output power to the estimated inverter power returns a regression coefficient (r2) of +0.98. A multiple regression works nearly as well as the Random Forest Regression and is easier to apply and this is the model that is used in MAP to calculate the predicted inverter power output.
Generate additional revenue from Demand Side Response (DSR)
-
Revenue from energy arbitrage is highly dependent on the following:
- Understanding details of the commercial power purchase agreements on site
- Forecasting solar generation so that the battery is charged from solar rather than imports from the grid. Using a pre-programmed profile to ensure battery has enough energy stored to discharge over peak, rather than trickle charging
- Forecasting site demand accurately so as to not push site into export
- Electricity is most expensive between 4-7pm. British Summer Time (BST) months have solar overlap with peak so it may not be best idea to discharge battery as this can to push site into export which can lose money.
A genuine bug in the system
Spider made a home in the center of the pyranometer
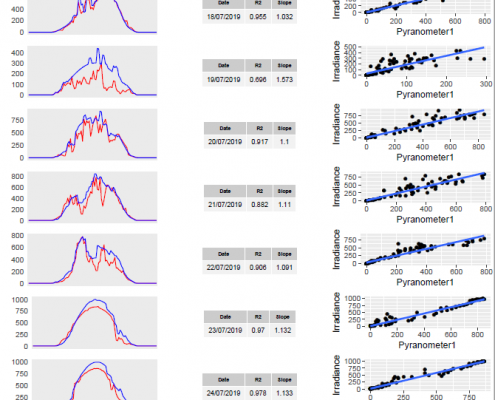
Why are the actual irradiance values so much lower than predicted?
Now we understand why, for a couple of weeks, the actual irradiance values were so much lower than predicted. We compared expected results from a number of sites – but all matched our predictions.
We remotely checked the settings on the pyranometer – all OK. Spoke to the manufacturer – everything seemed OK. So it’s a long drive and a site visit.
The culprit – a pesky spider with a juicy wrapped up fly for lunch. Right in the middle of the pyranometer. Problem solved!!


