Solutions built using the Meniscus Analytics Platform
These are all examples of web based dashboard solutions built using our earlier Meniscus Calculation Engine(MCE) or our Big Data Meniscus Analytics Platform (MAP)
Integrate rainfall analytics for any point or area with your own operational data
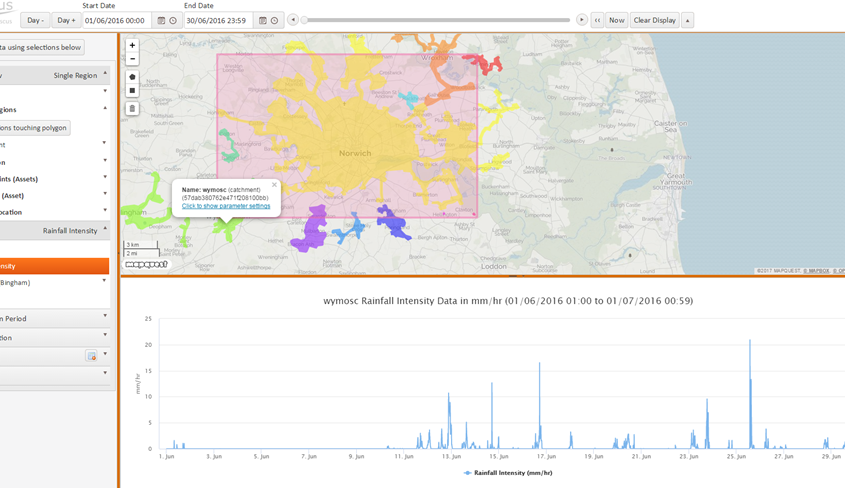
MAP Rain is our high performance cloud-based solution for delivering rainfall and flood monitoring analytics. MAP Rain is built using the Meniscus Analytics Platform and delivers historic and predicted rainfall analytics for any point and any area. Analytics include: Historic and predicted Return Period (FEH99, FEH2013 and Bilham); Current and predicted rain alerts (based on intensity and Return Period); Aggregation into polygons for any area using either stored polygons or polygons created on demand.
MAP Rain lets you mash together real-time weather data with your own corporate data helping you model and predict the impact that rainfall has on critical assets. MAP Rain is built using MAP and is used by Water Companies, Councils, Electricity companies and more to deliver a broad range of complex rainfall and weather analytics.
”Show_detail”
Weather is a key factor in the performance of many assets/services from wastewater treatment through to the number of shoppers in the High Street. Using our Restful API, developers can readily integrate MAP Rain into their own analytics solutions to derive their own real time weather related insights. MAP Rain provides the ability to aggregate weather data into geographic polygons such as wastewater catchments or postcodes.
”Hide_detail”
Smart Sewer network solution using real time and forecast rainfall data to predict flows in the sewer network
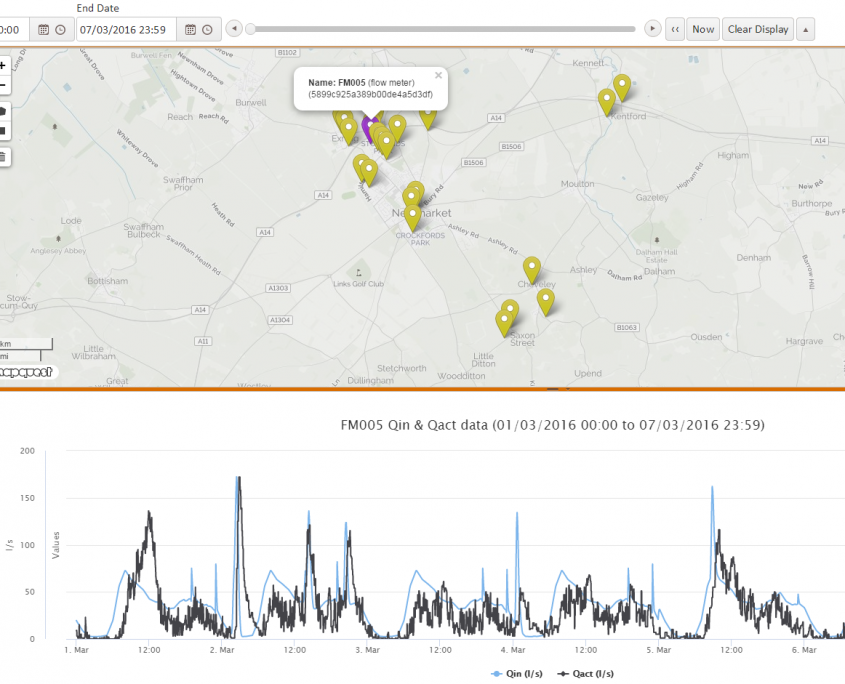
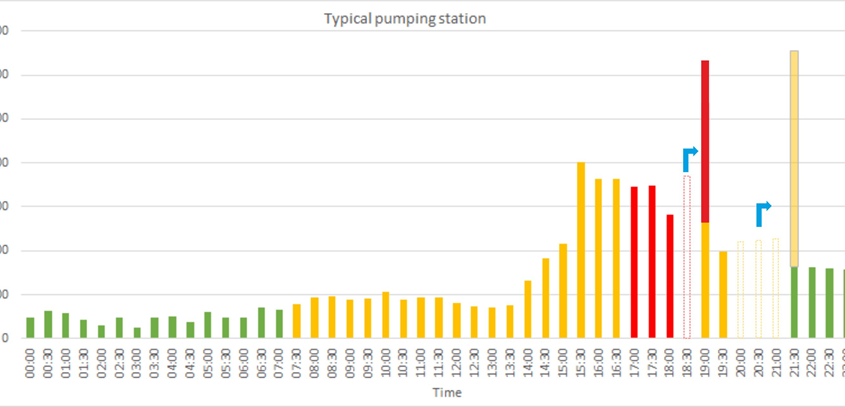
MAP Sewer is our SMART real time wastewater network decision support/modelling tool and is built using the Meniscus Analytics Platform. Using real time and forecast rainfall data, MAP Sewer delivers predictive analytics for hundreds of sewer catchments covering thousands of sub-catchments. It predicts hydraulic overload at pumping stations, combined sewer overflows and other points of interest and helps identify likely blockages in the sewer network. Combined with Demand Side Response programmes, MAP Sewer delivers energy cost savings by allowing companies to reduce pumping in high electricity tariff periods without increasing operating risk.
As well as helping reduce energy costs, MAP Sewer allows companies to rapidly run What If scenarios to understand the impact that changes in the network have on the predicted flows. As such, MAP Sewer can be part of a real time SMART sewer network to optimise existing capacity in the sewer network and so avoid capital expenditure.
”Show_detail”
MAP Sewer is a decision support tool. It uses simplified hydraulic models to predict flows in sewers, pumping stations, combined sewer overflows and detention tanks. These models are updated every 5 minutes as new rainfall data becomes available and they predict 36 hours into the future using forecast rainfall data. New catchments can be configured within minutes using a combination of the MAP Sewer dashboard and the MAP Client application.
”Hide_detail”
MAP IOT – using MAP as a platform to deliver large scale IoT analytics
Create you own IoT application and replicate to thousands/hundreds of thousands of devices
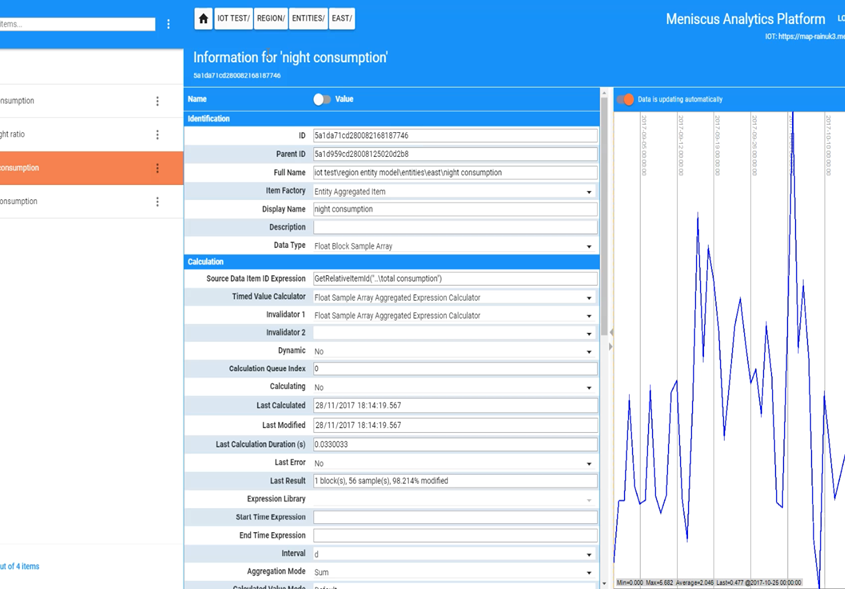
MAP IOT lest users create their own analytics for an Internet of Things device. Developers can create a template that configures the data structure and the calculations that will be applied to any new instance of a Thing. These templates can then be called via the API, allowing developers to rapidly create analytics for thousands of Things.
Using the web based MAP Client, developers can update their models and can add new properties and change existing ones. The MAP Client provides a quick way to visualise your data without having to extract it into your own dashboard solution.
”Show_detail”
Both MAP Rain and MAP Sewer have the analytics and models created in code in MAP as this delivers the fastest processing of the data. MAP IOT works at a layer above this and provides the developer with the same functionality but in a way that is more accessible through the MAP Client. The calculation syntax is based around C# and is more complex than the equivalent MCE calculation syntax – but is much more powerful.
”Hide_detail”
Solutions include: Process Plant analytics; Energy Savings; Energy dashboards
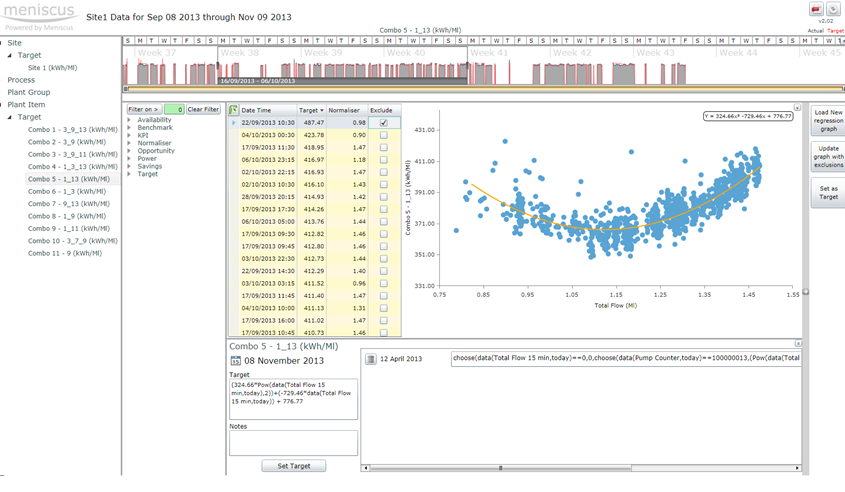
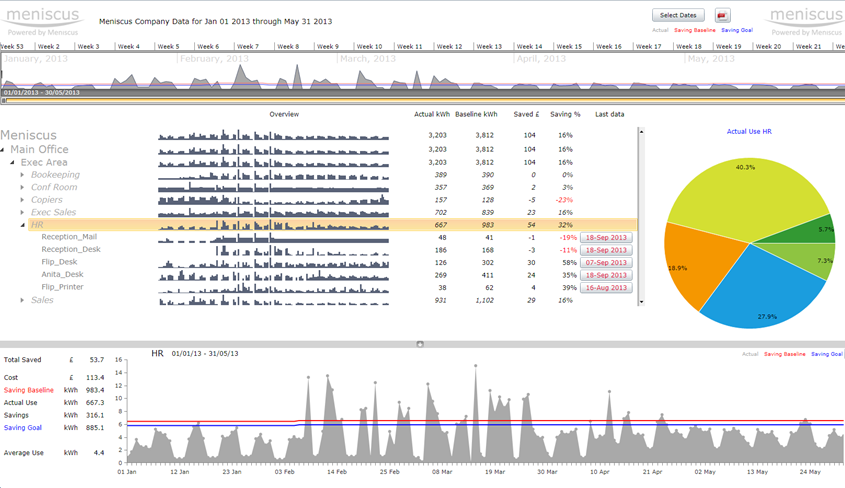
MCE delivers advanced energy management capabilities by giving users the ability to monitor the performance of their most energy intensive processes in a building or site such as; pumping, refrigeration, ventilation. MCE can deliver the key metrics to identify process inefficiencies as well as modelling complex electricity tariffs, providing real time energy metrics and much more.
Solutions include: Home Energy Energy dashboard using low cost real time clip on electricity meters; Processing data from 10,000+ hours run, kWh and kW meters to deliver complex process energy metrics; Identifying the optimal pumping combination on multi-pump pumping stations.
Users can access MCE using a Web Client. This allows users to set up the data structure as well as creating the calculations they want as well as costs, conversions, targets and exceptions limits – both high and low. There is also a PC based client for setting up and updating properties from large numbers of sites.
”Show_detail”
MCE is an established and proven product. It is ideal for small to medium sized applications where you want to monitor data from just a few up to a few thousand ‘Things’.
”Hide_detail”
MAP Hyperlocal Rainfall – accurate, location specific rainfall predictions
Uses current rainfall to deliver very accurate short term rainfall predictions for any point in the UK
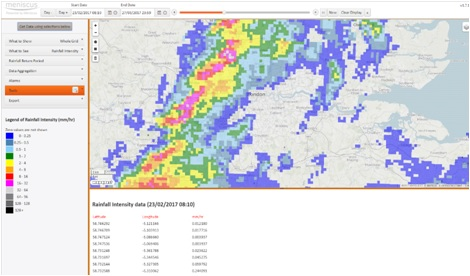
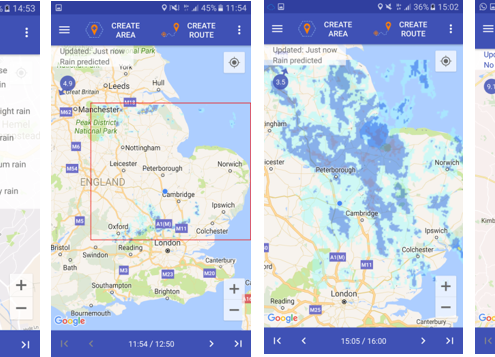
MAP Hyperlocal is built on our MAP Rain solution and is used to predict the path of each 1km2 cell of rainfall for any location within a cutout surrounding the UK – this is over 700,000 individual cells of data. Twelve predictions (one for every 5 minutes) are made for the next hour and these predictions are updated every five minutes as new radar rainfall data becomes available.
MAP Hyperlocal is processing over 250 million data points a day and delivering over 2,000 predictions a second.
Hyperlocal Rainfall is our Smart City app that uses MAP Hyperlocal to help city residents use more sustainable transport solutions, cycling and walking, by predicting if it will rain on their journey to and from work.
”Show_detail”
Hyperlocal Rainfall is a Smart City platform able to consume and fuse multiple datasets from different sources to deliver meaningful insight into how cities operate. Hyperlocal Rainfall delivers very accurate, journey specific predictions on the time and intensity of rainfall over the next hour so that users can plan journeys around the rain.
A Hyperlocal Rainfall mobile app is available for both the Apple and the Android operating platforms.
This project was funded by InnovateUK and being delivered as part of a consortium with Anglia Ruskin and Loughborough Universities and with the Peterborough Environment City Trust
”Hide_detail”

