
MAP Rain API calls
MAP Rain is our service delivering historic, real-time and predictive rainfall analytics. It is built using our Meniscus Analytics Platform (MAP).
We have set out examples of the basic MAP Rain API calls used to extract data from our demonstration site.
1 Download your Geometries (Points and Polygons)
These three MAP Rain API calls all use the same Method (Data.GetGeometryIdsWithinBoundary) to Particular Points or Polygons within a bounded area which in this particular case is a rectangle “-1.6836548,52.8110630;-1.6836548,53.0296520;-1.1837769,53.0296520;-1.1837769,52.8110630;-1.6836548,52.8110630”
Calls to return Polygons
Calls to return Monitoring Points
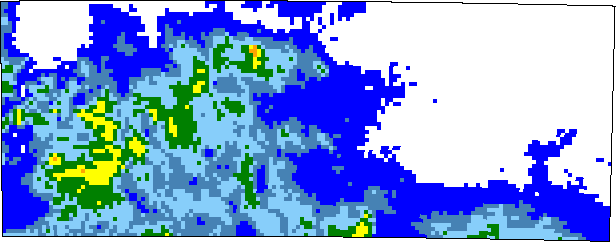
2 Rainfall image for an area
This call returns the upper left and bottom right co-ordinates of a polygon. It is used to define a selection box used in MAP Rain
Returns upper left and bottom right co-ordinates of a polygon
Returns
{ "minLat" : "52.657536", "minLng" : "-2.570289", "maxLat" : "53.200074", "maxLng" : "-0.280368" }
This call returns an image of the rainfall for a particular time and for a polygon bounded by the upper left and bottom right co-ordinates
3 Rainfall for a Location
This API call extracts rainfall data for any location. The user can extract rainfall intensity (mm/hr) or rainfall depth and for any time periods in this case from 22nd November to 6th December 2019
These calls combine two methods – which is why there are two sets of times.
The first method gets rainfall data for the cell (Data.GetCellRainfall) and the other method aggregates the rainfall (Data.Aggregation) – see 3.8 Aggregation
Using Easting and Northings
Returns upper left and bottom right co-ordinates of a polygon – using Eastings and Northings
Using Latitude and Longitude
Returns upper left and bottom right co-ordinates of a polygon – using Lat and Long
Returning location information for a Postcode
This call is used to look up the Eastings and Northings and the latitude and longitude for the requested postcode. It also displays a range of other information for the postcode
4 Rainfall for a Polygon
This MAP Rain API call returns rainfall metrics for a Polygon set up in MAP Rain for a particular time period – 22nd November to 6th December 2019
The MAP Rain Id of the Geometry is “58e50576a28f4b0da492651f” and this is obtained using the calls in 1 Download your Geometries
Rainfall Intensity (mm/hr)
This call uses two methods to return the data.
Data.GetGeometryAverageRainfall – this returns the rainfall intensity values
Data.Aggregate – this aggregates the values
Returns rainfall intensity for a Polygon
Rainfall depth (mm)
This call uses three methods to return the data
Data.GetGeometryAverageRainfall – this returns the rainfall intensity values
Data.Aggregate – this aggregates the values
Data.Convert – this converts rainfall intensity (mm/hr) every 5 minutes into rainfall depth (mm) – multiplies by 1/12
Returns rainfall depth for a Polygon
Bilham Return Period (1 in X years)
This call uses two methods to return the data.
Data.GetGeometryRainEventReturnPeriod – this returns the rainfall return period values – which bt default is set to the Bilham method
Data.Aggregate – this aggregates the values
5 Rainfall for a Point
This call returns rainfall metrics for a Monitoring Point set up in MAP Rain for a particular time period – in this example 22nd November to 6th December 2019
The MAP Rain Id of the Geometry is “58e50578a28f4b0da492654c” and this is obtained using the calls in 1 Download your Geometries
Rainfall Intensity (mm/hr)
This call uses three methods to return the data
Data.GetData(Data.GetItemId – Using the property “average rainfall” returns the rainfall intensity for this Point.
Date.Resample – this returns a subset of the data
Data.Aggregate – this aggregates the values
Returns rainfall intensity for a Monitoring Point
Rainfall Return period (1 in X years)
This uses the same call as the Rainfall Intensity but returns the data for property “rain event return period”
6 Return Period calculation
Return Periods can be calculated for Points and Polygons
These calls return the Return Period for Points for a large rainfall event on the 27th May 2018 at location 431602,335309
Maximum FEH99
Maximum FEH Return Period for a day and associated range of days
Note that this call will increase the start date of the event if the duration exceeds 12 hours and then again if it exceeds 48 hours
FEH99 for a set date range
Used to calculate the FEH99 return period for a date range in this case 27th May 2018 between 18:00 and 22:00 BST
FEH 99 Return Period for a date range
Maximum FEH2013 – Returns depth (mm), duration (hours) and return period for a day and location
Maximum FEH 2013 Return Period for a day and associated range of days
Note that this call will increase the start date of the event if the duration exceeds 12 hours and then again if it exceeds 48 hours
Maximum FEH2013 – Returns depth (mm) for a specific duration (hours), return period and location
7 Rainfall for an Environmental Agency Rain Gauge
This call returns rainfall intensity data for an Environment Agency rain gauge for a particular time period – in this example 22nd November to 6th December 2019
The MAP Rain Id of the Geometry is “596c74bea28f4b072011e36b” and this is obtained using the following call.
Return a list of the Environment Agency rain gauges within a boundary
Returns list of EA rain gauges within boundary
This returns the locations, names and properties of the EA rain gauges and gauging stations
Return the rainfall intensity data for an EA rain gauge
Returns rainfall intensity for an EA rain gauge
To return the radar rainfall data for the gauge location then refer to 3.3 Rainfall for a location
8 Aggregation over different time periods
Any MAP Rain API call can be aggregated to return data in different time intervals and with different aggregation functions.
The core aggregation method is
(Data.Aggregate,ToTime(2019,11,25,00,00,00),ToTime(2019,12,09,23,59,59),Data.Aggregation("","Sum","Forward")))
Aggregation Periodicity
In the method Data.Aggregation(“”,”Sum”,”Forward”) the value “” is the aggregation periodicity. Appropriate functions include:
None “” – Returns the native periodicity of the data and effectively ignores the aggregate function
15m – 15 minutes
30m – 30 minutes
h – hourly
6h – 6 hourly
12h – 12 hourly
d – daily
Aggregation Function
In the method Data.Aggregation(“”,”Sum”,”Forward”) the value “Sum” is the aggregation function. Appropriate functions include:
None – no aggregation is applied
Sum – sums the values across the time range
Average – averages the values across the time range
Max – returns the maximum values across the time range
Min – returns the minimum values across the time range
Aggregation Direction
In the method Data.Aggregation(“”,”Sum”,”Forward”) the value “Forward” is the aggregation direction. Appropriate functions include:
Forward – in aggregating forward the the 10:00 am hourly value will aggregate values from 10:00: to 10:59:59
Backward- in aggregating backward the 10:00 am hourly will aggregate values 09:00:01 to 10:00
Examples for a Monitoring Point
Returns average rainfall intensity aggregated every hour for a Monitoring Point
Returns maximum return period aggregated over a day for a Monitoring Point
9 Changing to CSV outout
You can change the methods to extract data as a CSV file by changing the method from Data.ToJSON to Data.ToCSV
This is the call to extract rainfall for a location into a CSV file
Example aggregation of rainfall intensity for a Monitoring Point
Returns average rainfall intensity aggregated every hour for a Monitoring Point in CSV format
Additional MAP information
Overview of Meniscus Analytics Platform (MAP)