MAP Rain – updated imagery for rainfall map

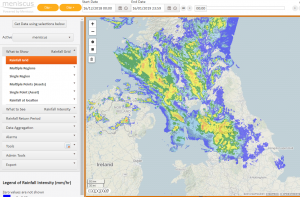
We recently updated MAP Rain to display rainfall as an image making it much faster to display new images. Previously we displayed rainfall for each individual 1 km square cell. MAP Rain processes data in km squares using the Ordnance Survey Grid Reference system but the dashboard uses the WGS84 projection. So to produce a suitable image we have to go through several stages.

  • Use the four corners of the visible area of the map and return the min/max Easting and Northings required to fully display the image. We add a small amount to each side to ensure it is covered on the screen.
  • Render an image for these Easting and Northings values from the internal grid that represents the data at the relevant time.
  • Then ‘warp’ this image to change the projection from a flat grid reference to the representation of that grid on the map. This is why the top and bottom of the returned trapezoid are curved and it is wider at the top than the bottom (imagine taking a sheet of paper and placing on a globe). We then display this image on the dashboard.
  • This process allows us to return different ‘zoom’ levels of the image with each having a better resolution. Most other mapping solutions limit the zoom level as they only display the one image for the whole of the UK.

    Click here for more information on MAP Rain and our rainfall map and dashboard

    Areal FEH 99 Return Period calculation for polygons

    As part of our aim of continuing to add complex rainfall analytics into MAP Rain we have added the Areal FEH 99 return period calculation that lets you create the areal return period for a polygon – this is the methodology as set out in the Flood Estimation Handbook.

    How to run

  • From the dashboard click on Rainfall Return Period
  • Set the date you are interested in using the top date selector
  • Select the polygon you are interested in
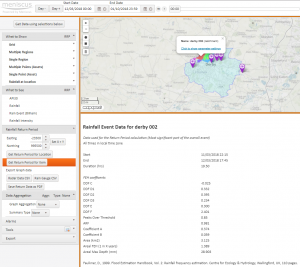
  • Select the “Get Return Period for Item” option under Rainfall Return Period
  • MAP Rain will then calculate the Areal FEH 99 Return Period and display all the coefficients and results in the map results pane along with a graph of the rainfall intensity for 3 days – includes the previous and the next days.

    Click here for more information on MAP Rain

    Yorkshire Water network resilience hackathon

    Overview of a one day hackathon using a closed data set to investigate how data analytics can help find the best locations for some +8,000 sensors. Details the solution delivered and developed on the day

    Improved architecture lets MAP scale on demand

    Our latest release lets us run multiple instances of core modules (importers, calculators and invalidators) on multiple servers with the ability to start and stop instances on demand.

    Yorkshire Water leakage hackathon – use of MAP IOT

    Overview of the Open Data leakage hackathon run by Yorkshire Water to identify new ways of applying Big Data and analytics solutions to the issue or water leakage

    InnovateUK project to deliver solar intensity predictions

    This project uses near real time satellite imagery to create short term predictions of output from PV farms to help optimise revenues for sites having battery storage

    Automated invoice generation and management reporting for CHP units

    Meniscus was recently approached by a power company to create an automated invoice generation and management reporting service for their CHP units. The invoices will be based upon raw data sent to the Meniscus servers and include using a range of key variables and unit rates that will be entered into a simple bespoke web page.

    MAP came to the fore as it is specifically designed to be both scalable and very flexible.  A comprehensive RESTful API is available that lets users configure every element of the underlying database and to add or delete and update any element of the platform. This API is used to build a mobile friendly website that provides configuration capability, analytics, widget graphs and a data import facility.

    Because MAP is deployed on a variety of cloud servers it means any new server instances can be readily available online as users require.

    invoice-management

    The main benefits when using the Meniscus Analytics Platform (MAP) are:

    Ø It enables integration and automation of more complex analytics directly into your services.

    Ø It provides a means to rapidly develop and deploy new solutions and services.

    Ø Provides flexibility to change the analytics being delivered as a solution matures and evolves.

    Ø Provides a means to reliably scale, from a pilot scale up to a full-scale project, quickly and easily.

    Ø It is a cost effective way for delivering complex analytics.

    Setting up the database

    Meniscus will be setting up the database to deliver the invoice information using the actual data uploaded from each CHP unit that uploads data to the Meniscus servers.

    An initial ‘template’ site will be created using the most complex tariff structure envisaged. The invoice data from this one site can then be used to test the calculation accuracy using a range of input variables and a range of imported raw data. Once this ‘template’ site is verified then it will be used as the basis for all other CHP sites.

    The validation process will be replicated in case changes are required to this template site at a later date.

    Importing data

    Meniscus will create a bespoke importer to convert the CHP data into the required format for import into MAP.

    Bespoke dashboard

    Meniscus will set up a simple yet secure ‘one-page’ dashboard to enable staff to enter and update key variables and unit rates as and when required.

    Management reporting

    Meniscus will set up two management reports. These reports will be run on a scheduled basis (e.g. daily, weekly or monthly).

    Formatted output

    Meniscus will collate and format the output data into an agreed format which will be forwarded at the end of each month and will form the basis of the invoice data.

    Hosting Services

    Specific Hosting Services

    Ø Processing data received to create the required output invoice format. Raw data files will be uploaded from the CHP units at daily intervals and MAP will automatically process all the available data. This effectively means that it will be possible to view invoice data for the current month at any point in time.

    Ø Delivering scheduled management reports.

    General Services

    Ø Provide server facilities that include the appropriate data backup and failover capability.

    Ø Provide telephone and e-mail support.

    Ø To carry out reasonable minor updates and changes to the database and associated calculations if requested by the customer.


    Meniscus Systems Limited Shortlisted in Selection Process CivTech

    Meniscus received news this week they are through to the short-listed stage of the CivTech ® Pilot 2016.

    The CivTech® Pilot is seeking new technologies to drive bold innovation in the public sector. It brings together private sector innovation, public sector organisations and citizens to develop more efficient and effective products and services, which will translate to new, better, faster and easier experiences for everyone.

    Backed by the Scottish Government, it is going to provide an unprecedented route for entrepreneurs, start-ups, SMEs and other businesses to develop the benefits of digital transformation in the public sector, creating an opportunity for businesses to win public sector contracts.

    The first of the six-part challenge process saw all 85 applicants completing their application to determine the overview of their idea, their level of innovation, and commercial potential.  The second stage in the process, the Exploratory stage, included assessments on the participant’s business acumen, team and exploratory skills.

    Meniscus Systems Limited has successfully reached the third stage of the selection process and is hoping to provide a potential, and successful, solution for challenges taking them into the Accelerator stage where they will work to further develop their potential solution, engaging closely with the Challenge Sponsor and the CivTech ® pilot team, further establishing the viability of their potential solution, and address any issues that have been brought up.

    The six Challenges are simply a problem which a Challenge Sponsor (public sector organisation) would like solved. CivTech® pilot is focusing on the following areas.

    Challenge 1: How can we help improve air quality in urban areas?

    Challenge 2: How can we make our flood forecasting information better used by a wider audience?

    Challenge 3: How can we get health and social care data and analysis to the widest possible audience?

    Challenge 4: How can we make our data publications more accessible and appealing?

    Challenge 5: How can we promote the tourist destinations along the A9?

    Challenge 6: How can we use technology to design smart roads?

    Mike Everest, Managing Director and owner of Meniscus Systems Limited, commented, ‘We are delighted to have been shortlisted in two very diverse and exciting markets, challenge 1 and 6, namely Air Quality work and a SMART Road project for the A9 dualling. This is a long-term development of the A9 as a dual carriageway.’

    Mike further said, ‘We have a pitch to present next week to see if we make it to the next stage of the challenge, which will be the Accelerator stage where an initial implementation of the project takes effect to start to meet the needs of the challenge.’

    Civtech® will announce the Accelerator finalists on 5 September 2017.



    Meniscus Launches Analytics Platform “MAP” on FATHOM Store

    Platform turns disparate data into real-time information for the water industry

    Huntingdon, Cambridgeshire – June 20, 2016 — Meniscus, an analytics software company that provides high-performing, flexible and scalable cloud-based tools for the development of bespoke applications, today announced a new partnership with FATHOM Water Management, Inc. (“FATHOM”). Meniscus will offer its proprietary analytics platform MAP through the FATHOM Store, an online marketplace designed to enable simple, fast and risk-free adoption of new technologies for water utilities.

    With MAP, customers can:

    • Monitor chemical costs, use, and optimization
    • Monitor process based energy costs, use, and optimization
    • Integrate real-time rainfall data into the organization

    Mike Everest, managing director of Meniscus, commented, “As a cloud-based service delivering process-based energy, chemical, and weather based analytics services, working with FATHOM is key for us. First, it provides access to data stored on the FATHOM cloud servers, which simplifies the delivery of our services, and secondly, it provides exposure to many water companies in the U.S. We look forward to the opening of the FATHOM Store to help accelerate the adoption of our platform by water utilities across the country.”

    The FATHOM Store is a simple, secure data integration platform that connects water utilities with technologies that help streamline business processes, recover revenue and better engage with customers. FATHOM’s expert team thoroughly vets each product submitted for consideration to the Store and selects only the top-performing tools like MAP for inclusion. Through open application program interfaces (APIs), technology companies can exchange data with FATHOM, as well as utilities, to deliver maximum value.

    Utilities can now easily access and acquire MAP without the risks common to technology adoption.

    “Nationwide, more than 56,000 water systems are searching for technologies that can help them make the most efficient use of ever-dwindling resources. Unfortunately, finding, vetting and integrating new technologies demands a level of investment most cannot afford to make – until now,” said Trevor Hill, CEO of FATHOM. “Through the FATHOM Store, we are connecting technology innovators, like Meniscus, directly to the utilities that need their support most. By mitigating the time and financial commitment required to modernize water utilities’ processes, we are propelling the Smart Grid for Water into reality.”

    The FATHOM Store is available at https://store.gwfathom.com.

    About Meniscus

    The vision behind Meniscus of turning raw data into valuable information was the idea of Managing Director Mike Everest.  Meniscus ensures use of all the data collected to identify problems early and to help businesses operate more efficiently and at lower cost, and so the idea of automatically calculating performance metrics from operational data was born. Meniscus is focused on adding value to existing data and delivering data analytics to the connected world.  Visit www.meniscus.co.uk for more information.

    About FATHOM

    FATHOM is a software-as-a-service company helping water utilities do more with declining resources. With rapidly deployable, risk-free, cloud-based solutions that address all aspects of the meter-to-cash verticals for water utilities, FATHOM increases revenue, decreases costs and delights customers. Water utilities trying to simplify the adoption of technology can use the FATHOM Store as a marketplace to acquire and access new technology. FATHOM was built by a water utility, for water utilities and delivers a risk-free solution to more than 160 community water systems across the United States. There is strength in numbers. To learn more, visit www.gwfathom.com

    Service in the digital outcomes and specialists category

    Meniscus is now providing service in the Governments G-Cloud Digital Outcomes and Specialists category under performance monitoring to give PaaS (Platform as a Service) solutions to Government bodies. Specifically we are providing Digital Outcomes and will provide teams to research, test, design, build, release, reiterate, support or retire a digital service.

    Meniscus Calculation Engine (MCE) allows users to set up their own complex set of calculations to turn any raw data into the calculated metrics required to monitor the performance or costs of an asset. Includes e-mail alert generation, reporting, target setting and performance monitoring. Ability to replicate information to thousands of locations.

    We are in the Platform as a Service category within the Cloud technology and support section on the digital marketplace.