New makeover for the original MCE Analytics Engine!

Our original MCE analytics engine has had a bit of a makeover! A new AngularJS webclient and updated Javascript widgets have revitalised the analytics engine. It is just as fast, just as flexible and just as easy to use. However, the new AngularJS dashboard makes it much easier to set up, configure and modify Items. The new Javascript widgets also make it easier to create your own dashboards and to display the metrics you need.

MAP Rain model infographic

MAP Rain model infographic shows some of the analytics solutions built using the MAP Rain model

MAP Rain is a generic real-time model built using MAP for processing, primarily, radar and forecast rainfall data. The model delivers all the underlying process of fusing the historic, current, Hyperlocal (our own 1-hour forecast) and forecast rainfall data together for any area, resolution, or size of cutout (the area over which we process the rainfall data). Built into MAP Rain are lots of methods to re-sample, aggregate, extract and re-process the rainfall data. These ensure we have the flexibility to apply rainfall data to any point or polygon in the overall cutout area. All these methods are available as API calls.

We use MAP Rain to build a broad range of applications that have rainfall data at their heart. The number of such applications continues to rise and we can deliver all these applications to multiple customers on one instance of MAP.

MAP Rain Infographic

More information on MAP Rain

Current Hyperlocal Storm alerts

These are the Hyperlocal Storms alerts (beta) identified around the UK for today. Using real-time radar rainfall we are tracking the path of areas of high-intensity rainfall and predicting their movement over the next hour, at 5-minute increments, using a machine learning algorithm. As these Hyperlocal Storms pass over any village, town or city we generate an alert. For customers interested in particular cities then we can create the alerts for any postcode sector in the city.

This is part of our MAP Rain service. For more information then click here.

We have created our own Hyperlocal Rainfall predictions for the past 5 years. Click here for more information and you can download the Hyperlocal Rainfall app on both the Google Playstore and the Apple App Store.

MAP Solar infographic

Overview of the solar model built with MAP to predict solar irradiance


The objective of the project was to provide a way to optimise the integration of battery storage and PV solar power. By predicting solar irradiance, and hence solar power from PV installations, gives solar plant operators the ability to maximise revenues by charging and discharging batteries at the optimum time.

The project integrates near real-time satellite imagery, AI and an external Python solar calculation library with the core MAP framework to deliver an innovative and accurate way to predict solar irradiance data.

MAP Solar Infographic

More information on MAP solar

Key Partners in the InnovateUK funded collaborative project
Open Energi
National Solar Centre
Cornwall Council

MAP IoT Entity infographic

Overview of the MAP IoT Entity model used to build IoT applications

MAP IoT Entity model gives developers the ability to create their own Entities or Things in MAP. It makes use of the core MAP framework and integrated analytics stack to hide all the complexity of creating calculations, associations, alerts. More importantly, it does this at scale and in near real-time. This allows developers to focus on creating the underlying algorithms they want and in developing their dashboards/user interfaces. The MAP IoT Entity model takes a lot of the principles of the original low-code MCE Calculation Engine and applies them at scale – but you will need to be a developer to use MAP!

MAP IOT Infographic

More information on the MAP IoT model

Hyperlocal Storm – predicting high intensity storms at any location

Hyperlocal Storm

Hyperlocal Storm tracks high-intensity rainfall, in near real-time, and predicts the movement of the storm for the next hour at 5-minute intervals.

We then overlay this information with a map of all urban extents in the UK to identify ANY village/town that will be affected. For major urban areas, we are generating alerts at the postcode sector level.

This service will be of particular interest to Councils and Companies covering large rural areas or having large numbers of locations dotted around the country.

The image below shows an example of the urban extents and postcode sectors around the Leeds area.

Example of urban extents around the Leeds area

Why is this different – what is the benefit?

At present, using our MAP Rain point or polygon alerts, we identify rain events happening over the next 30 hours using forecast data. But, we need to know the location of that point or polygon.

With Hyperlocal Storm, we can identify any area at risk, without having to set that area up beforehand. So, for large rural areas, like Lincolnshire, we can predict these storms for any urban area across the 20,000+ km2 council area.

Next steps?

We are finalising testing at the moment and trying to work out the best way to visualise this information and/or share it with partners. This is where we need some help. We are keen to understand how users might want to use this information and share it within their organisations or with residents.

More information on MAP Rain click here

MAP Rain selected as finalist for Wessex Water EDM monitoring Proof of Concept

MAP Rain uses Machine learning for EDM monitoring to identify blockages and reduce the number of alerts generated from CSOs during wet weather

Meniscus are really pleased to be selected for the Wessex Water Proof of Concept looking at making smarter use of EDM monitoring data. MAP Rain has been chosen as one of three solutions to be trialed during the 3 month Proof of Concept. This follows a rigorous review of competition entries from 30 companies.

The trials will run for the next three months and will involve Wessex Water feeding these companies near real-time EDM data to see if they can correctly mute alarms and identify blockages, some of which will be simulated in a controlled environment.

Wessex Water Marketplace and objectives for the challenge

Strategic technology planning manager Jody Knight hopes to see a multitude of benefits from this data driven approach. These include reductions in blockages and CSO spills to alleviate impact on the environment, and lower volumes of alarms during rainfall periods, which will allow staff to work more efficiently and improve their reporting efficiency.

“The Marketplace approach has challenged the normal procurement channels for these emerging technical and data-related problems we encounter with our sewer network,” explained Jody.
“We have managed to communicate the problem to a wider supplier base and received proposals from companies that we may not have normally reached.

“The number of potentially viable and different solutions proposed by the companies in this challenge is encouraging to see as we move toward becoming a more data-centric business and we are grateful for all who have taken part in this challenge.”

Wessex Water launched its Marketplace in 2019 as a first-of-its-kind model for the water industry to increase collaboration with companies both in and out of its usual supply chain.

The online platform shares real data for each challenge that is posted and was designed to uncover alternative ways of managing water and waste, outside of the traditional asset-focused approach, leading to a better service and better value for customers.

More information on MAP Rain click here

For more information on the Wessex Water Marketplace click here

MAP Rain case study – Leeds City Council and storm Ciara

Case Study overview

Leeds City Council use MAP Rain to analyse historic rain events and to receive forecast rain alerts. This is a summary of the alerts generated for storm Ciara on the 9th and 10th February 2020 and compares actual rainfall against the alerts generated.

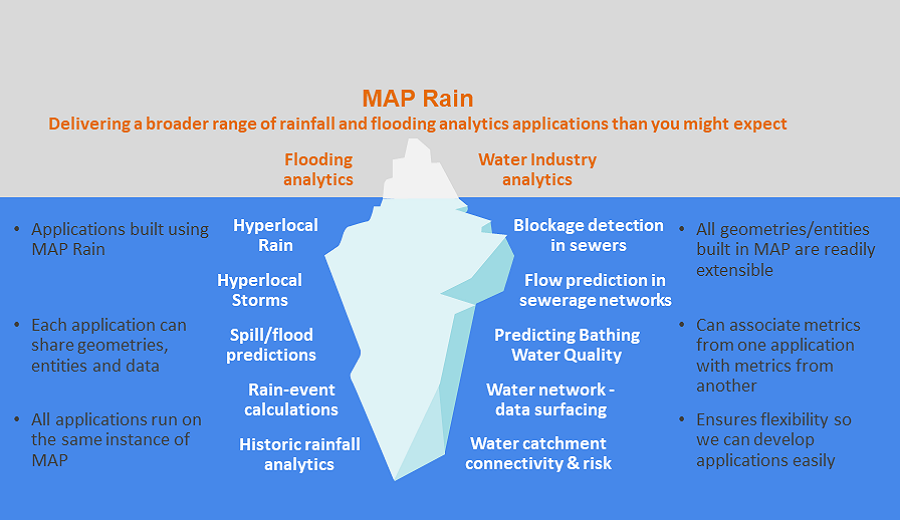
MAP Rain supports different type of rainfall alerts. The alerts for Leeds include:

  • Forecast rainfall alert (mm/hr). Generated when the forecast rainfall exceeds a threshold value
  • Current rainfall alert (mm/hr). Generated when the actual rainfall exceeds a threshold value
  • FEH rainfall alert (1 in X years). Generated when the FEH Return period alert exceeds a threshold value
  • MAP Rain constantly reviews and calculates these alerts every 5 minutes as new radar and forecast rainfall data is received. E-mails are sent to the Flood Management team according to a set of rules designed to limit the number of e-mails sent.

    Over the last two years, the Leeds City Council Flood Management team have been very pro-active in reviewing and adjusting these threshold values in light of historic flooding events. They have also adjusted the location of the monitoring points to correlate them more precisely to locations at risk.

    Quote from John Bleakley Group Engineer (Investigations) on the 18th Feb 2020.

    “One of the big successes from a surface water flooding impacts perspective (not river) for me was Meniscus after lots of tweaking. For Ciara we had hundreds of Meniscus warnings and they were pretty much spot on from where I sit, which means we can galvanise our efforts in those areas with more confidence in the future, contrast storm Dennis a week later, there were hardly any Meniscus rainfall alerts for our district which again, was borne out in reality by no flooding impacts in the Leeds District.”

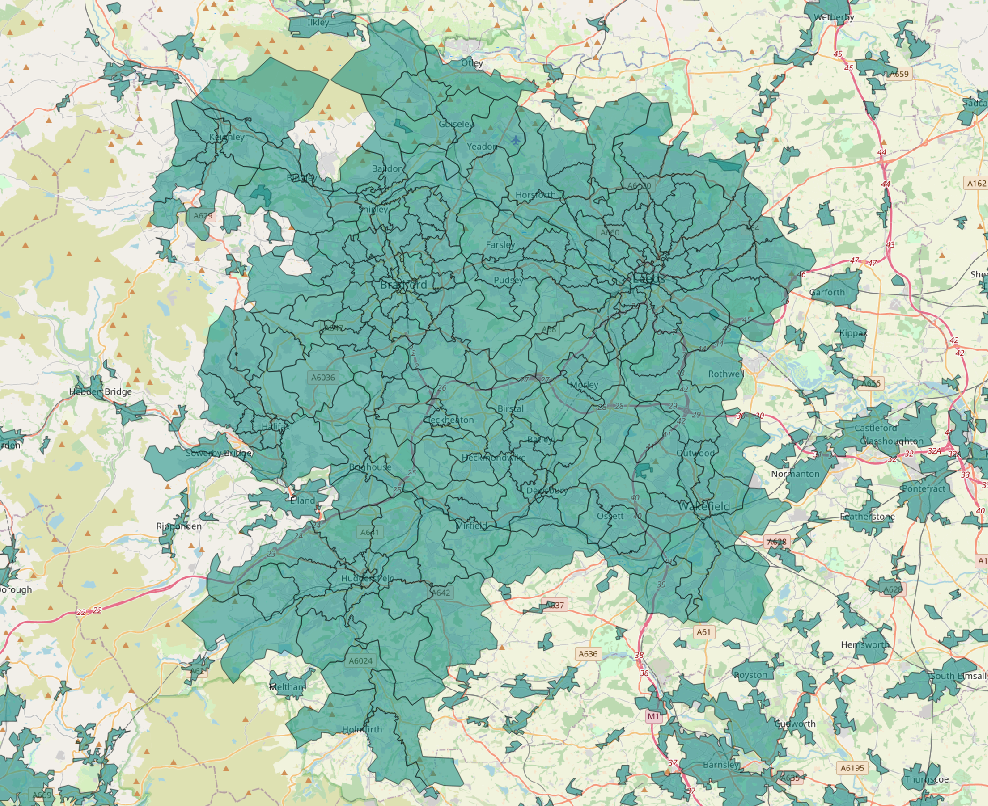
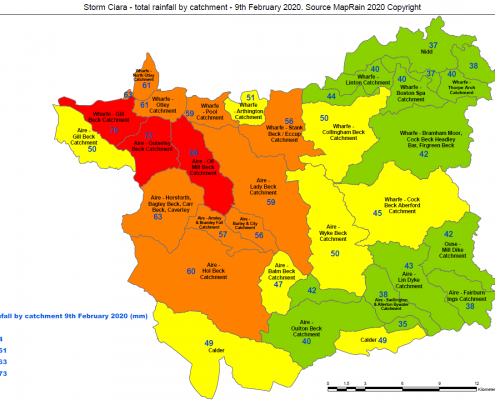
    Actual rainfall depth – issued by Leeds City Council flood team on the 10th February

    The choropleth map shown below was created by the Leeds City Council flood team the day after the event using data from MAP Rain. The image was tweeted to residents the day after the storm and is a great example of the use of maps to communicate the location and depth of the rainfall that affected the community.

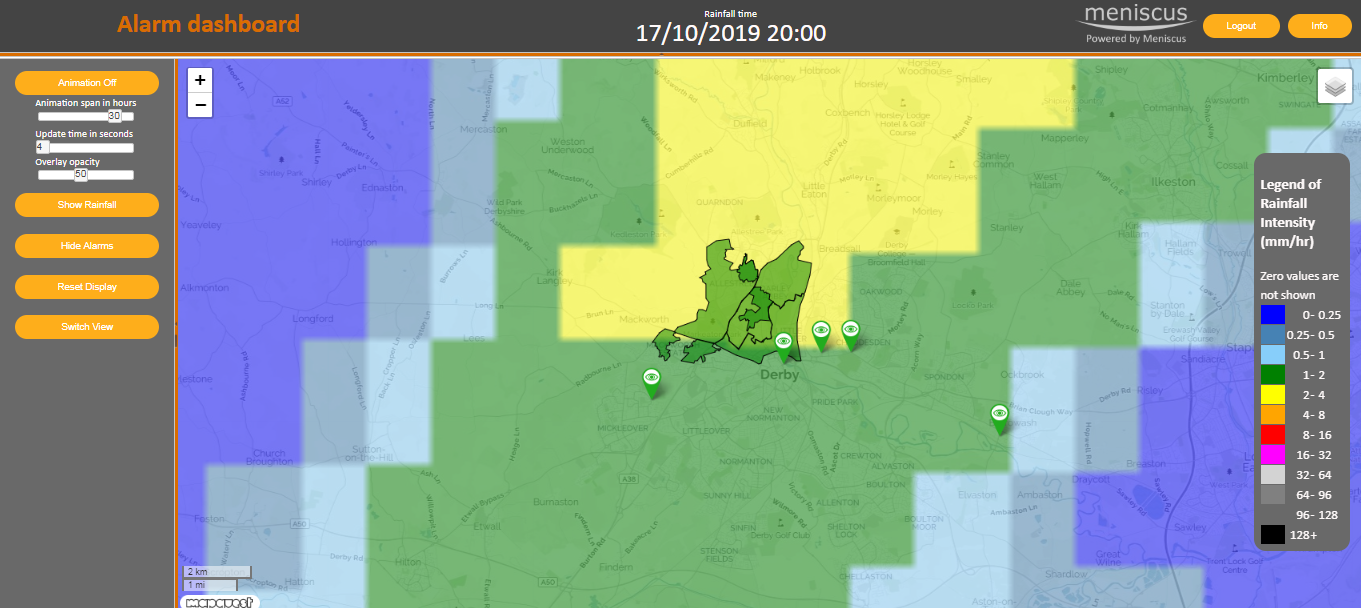
    MAP Rain FEH rain event Alerts

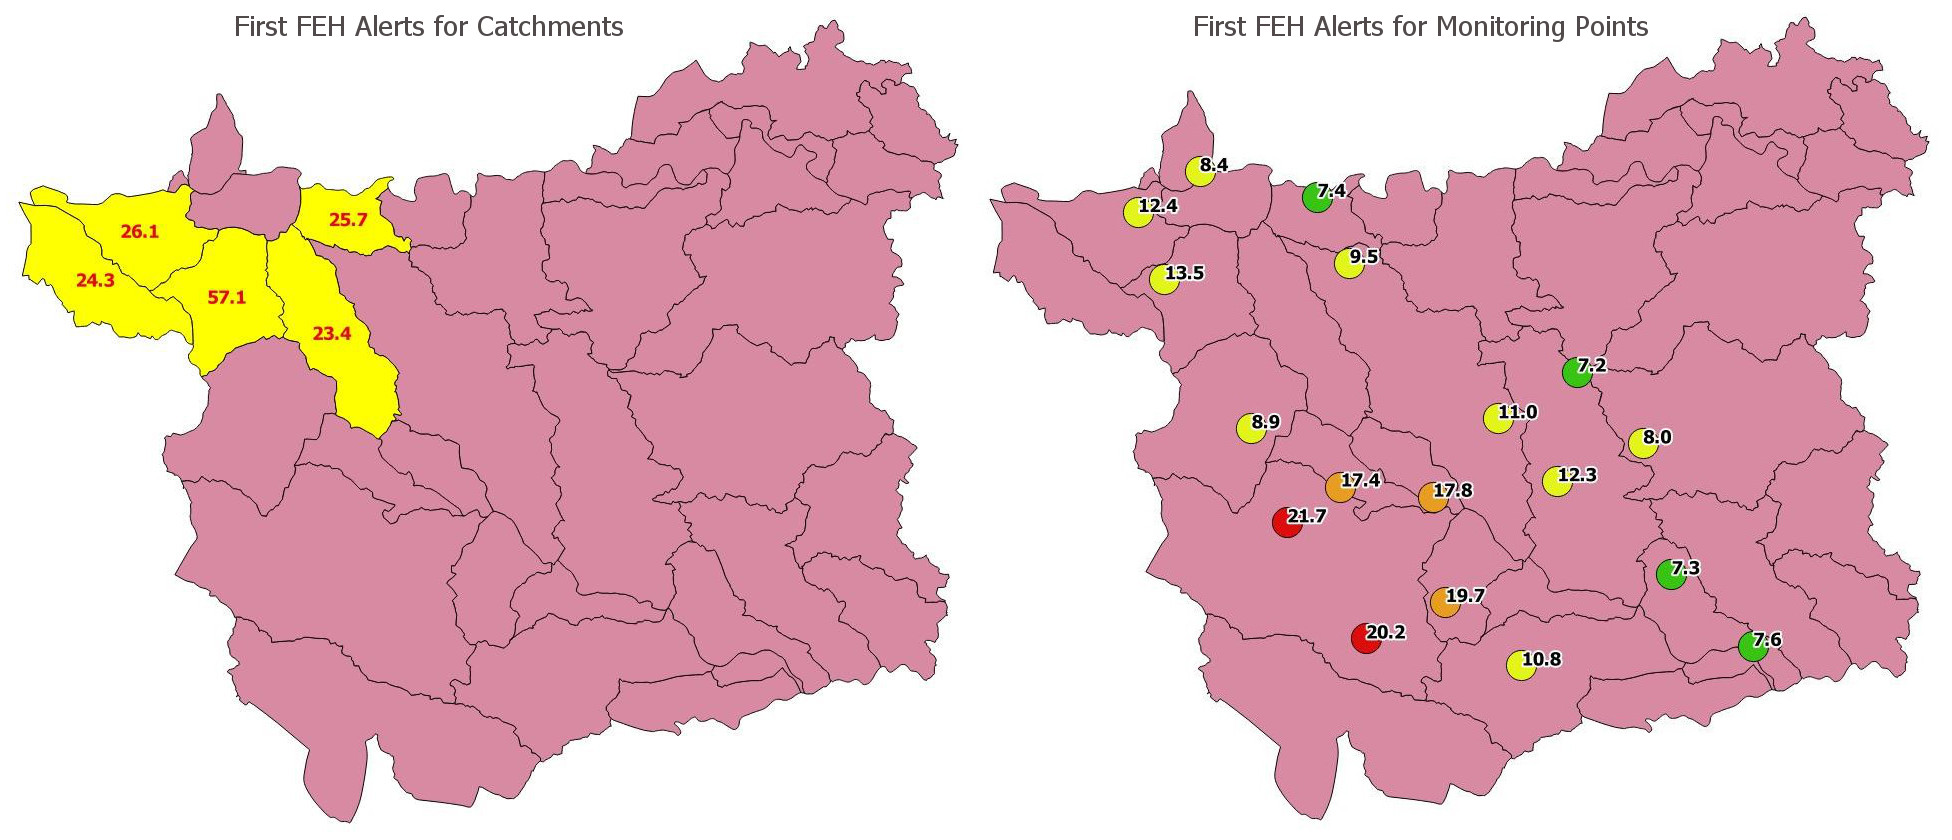
    For storm Ciara, MAP Rain generated alerts for 5 catchments and 18 monitoring points. These alerts were e-mailed to Leeds City Council and latest alert status was displayed on the MAP Rain dashboard.

    Alerts for the monitoring points were generated earlier than the catchment alerts and also changed more frequently. This is a consequence of the inherent averaging associated with the catchment alerts. The catchments aggregate the rainfall for all the underlying rainfall cells and this averaging, or smoothing, means they react slower to changes in the forecast rainfall.

    The two images below display the results for the first FEH Alerts generated for the storm. The left-hand image shows the first catchment alerts (shown in yellow). The right-hand image shows the first point-based alerts with their corresponding colour coded legend. The numbers are the calculated FEH rain event predicted for the catchment or point.

    The first monitoring point alerts were generated at approximately 09:45 on the 8th February with the majority generated from about 20:00 on the 8th, some 4-5 hours before the start of the heavy rain.

    The first catchment-based alerts were created later at about midday on the 9th February.

    Click here for more information on MAP Rain

    MAP Rain – new forecast alert dashboard

    Our new MAP Rain alert dashboard now makes it much easier to keep track of forecast rain alerts for Points and Polygons in your area of interest. The alert dashboard updates every 5 minutes, as new rainfall data arrives, and updates the colour of your Points and Polygons depending on the level of flood risk. The alert dashboard also displays an animation of the forecast rainfall across the UK

    The new forecast alert dashboard provides a simple way to see the alert status of your Points and Polygons along with an annimation of the forecast rainfall for the next 36 hours. We have designed this as a simple way to monitor flooding risk 24/7.

    For a live demonstration of MAP Rain then click here and set Username and Password both to demo.

    Toggling between current (Query) view and new Alert view

    We have added a new button which switches between the existing view of the dashboard and the new Alert view.

    New Alert view

    The purpose of this new Alert view is to provide customers with a simplified 24/7 view of the rainfall and associated alerts in their area of interest.

    1. Click on the “Show Alarms” button to see the forecast state of your Points and Polygons
    2. The Alert colour will change as the alert state changes. The Points and Polygons will default to show the green Clear alert
    3. The dashboard refreshes every 5 minute so both the dashboard and the emailed alerts will be synchronised
    4. You can add an animation of the forecast rainfall for the next 36 hours. The animation shows the forecast rainfall for each hour and continuously replays. You can customise the speed of the update, the opacity of the image and the forecast duration
    5. You can stop the animation and use the Show Rainfall button to select historic or forecast rainfall for a particular time using the time slider that will appear. Note: The Points and Polygon alerts will not display historic colour changes, they only show show forecast alerts
    6. The forecast rainfall is displayed for the whole of the UK so you can have a better understanding of the rain that will impact your area of interest.
      Can switch back to the original dashboard view using the “Switch View” button.

    Lazy loading for processing large data sets

    Introduction

    This is part of a series of articles where we describe the way the Meniscus Analytics Platform (MAP) works. Theses articles jump into the features that make MAP different to other analytics applications by providing an Integrated Analytics Stack delivering real time analytics.

    This article investigate the benefits of lazy loading of data and why this is important in MAP

    What is lazy loading of data?

    Quite simply, it means only loading the part of the data that is required to deliver the information requested. In terms of how MAP works then this principle is used to limit the data input and output from the the underlying MongoDB database into MAP. Whilst this may sound like quite a simple and obvious principle to apply it isn’t always used. Many developers will know the principle when developing dashboard and user interfaces but it is more important when considering the back end database operation.

    Lazy loading is a design pattern commonly used in computer programming to defer initialization of an object until the point at which it is needed. It can contribute to efficiency in the program’s operation if properly and appropriately used. The opposite of lazy loading is eager loading. This makes it ideal in use cases where network content is accessed and initialization times are to be kept at a minimum, such as in the case of web pages.

    Source

    Why is lazy loading relevant in MAP?

    MAP ingests and processes very large volumes of near real time data, specifically data associated with weather. More importantly, MAP holds historic data so that we can deliver historic analytics as used in our MAP Rain solution.

    This means data IO is a key factor in delivering the lighting fast calculation speeds that MAP delivers. So, anything that can improve these IO times is of huge importance to MAP. Lazy loading reduces data volumes extracted and then written back to the database and so improves data IO times.

    About MAP

    MAP is an Integrated Analytics Stack providing a framework for users to create and deploy calculations at scale using any source of raw data. MAP is based on IOT principles and uses Items as the underlying building blocks to store either RAW or CALCulated data. So, users create an Entity Template or Thing using these Items and then replicate this template hundreds of thousands of times using an ItemFactory.

    For more information on MAP then click here