MAP Rain model infographic

MAP Rain model infographic shows some of the analytics solutions built using the MAP Rain model

MAP Rain is a generic real-time model built using MAP for processing, primarily, radar and forecast rainfall data. The model delivers all the underlying process of fusing the historic, current, Hyperlocal (our own 1-hour forecast) and forecast rainfall data together for any area, resolution, or size of cutout (the area over which we process the rainfall data). Built into MAP Rain are lots of methods to re-sample, aggregate, extract and re-process the rainfall data. These ensure we have the flexibility to apply rainfall data to any point or polygon in the overall cutout area. All these methods are available as API calls.

We use MAP Rain to build a broad range of applications that have rainfall data at their heart. The number of such applications continues to rise and we can deliver all these applications to multiple customers on one instance of MAP.

MAP Rain Infographic

More information on MAP Rain

MAP Solar infographic

Overview of the solar model built with MAP to predict solar irradiance


The objective of the project was to provide a way to optimise the integration of battery storage and PV solar power. By predicting solar irradiance, and hence solar power from PV installations, gives solar plant operators the ability to maximise revenues by charging and discharging batteries at the optimum time.

The project integrates near real-time satellite imagery, AI and an external Python solar calculation library with the core MAP framework to deliver an innovative and accurate way to predict solar irradiance data.

MAP Solar Infographic

More information on MAP solar

Key Partners in the InnovateUK funded collaborative project
Open Energi
National Solar Centre
Cornwall Council

MAP IoT Entity infographic

Overview of the MAP IoT Entity model used to build IoT applications

MAP IoT Entity model gives developers the ability to create their own Entities or Things in MAP. It makes use of the core MAP framework and integrated analytics stack to hide all the complexity of creating calculations, associations, alerts. More importantly, it does this at scale and in near real-time. This allows developers to focus on creating the underlying algorithms they want and in developing their dashboards/user interfaces. The MAP IoT Entity model takes a lot of the principles of the original low-code MCE Calculation Engine and applies them at scale – but you will need to be a developer to use MAP!

MAP IOT Infographic

More information on the MAP IoT model

MAP Rain selected as finalist for Wessex Water EDM monitoring Proof of Concept

MAP Rain uses Machine learning for EDM monitoring to identify blockages and reduce the number of alerts generated from CSOs during wet weather

Meniscus are really pleased to be selected for the Wessex Water Proof of Concept looking at making smarter use of EDM monitoring data. MAP Rain has been chosen as one of three solutions to be trialed during the 3 month Proof of Concept. This follows a rigorous review of competition entries from 30 companies.

The trials will run for the next three months and will involve Wessex Water feeding these companies near real-time EDM data to see if they can correctly mute alarms and identify blockages, some of which will be simulated in a controlled environment.

Wessex Water Marketplace and objectives for the challenge

Strategic technology planning manager Jody Knight hopes to see a multitude of benefits from this data driven approach. These include reductions in blockages and CSO spills to alleviate impact on the environment, and lower volumes of alarms during rainfall periods, which will allow staff to work more efficiently and improve their reporting efficiency.

“The Marketplace approach has challenged the normal procurement channels for these emerging technical and data-related problems we encounter with our sewer network,” explained Jody.
“We have managed to communicate the problem to a wider supplier base and received proposals from companies that we may not have normally reached.

“The number of potentially viable and different solutions proposed by the companies in this challenge is encouraging to see as we move toward becoming a more data-centric business and we are grateful for all who have taken part in this challenge.”

Wessex Water launched its Marketplace in 2019 as a first-of-its-kind model for the water industry to increase collaboration with companies both in and out of its usual supply chain.

The online platform shares real data for each challenge that is posted and was designed to uncover alternative ways of managing water and waste, outside of the traditional asset-focused approach, leading to a better service and better value for customers.

More information on MAP Rain click here

For more information on the Wessex Water Marketplace click here

MAP IoT Entities – Introduction

MAP IoT Entities – an Introduction

MAP IoT Entities give you control on how to turn raw data from a sensor, device or …anything, into the analytics you want. Entities include Raw Items and Calc Items and both are contained in an Entity Template. This Entity Template is called as often as you want by importing configuration files. These config files include names and properties of the Entity and the properties for the Raw and Calc Items. On import, the Entity Template creates the Entity and the Raw and Calc Items and immediately starts processing any raw data that is available.

This is the first of several articles that we will write on how to use MAP IoT Entities to deliver your IoT application.

What are MAP IoT Entities?

Raw Items
A Raw Item contains the raw data that you upload into MAP. Raw data contains any Data Type that you want. If we don’t support the Data Type already (we support quite a range) then you can create your own Data Type – article on Data Types.

Calculated Items
A Calc Item contains the metrics that you want to create using your raw data. Rather than create all your analytics in one complex algorithm, our experience is that it it is easier, more flexible and quicker to create a number of seperate Calc Items that each do a specific part of the analytics.

A core module of MAP is the Invalidator. This continually monitors the calculation time of all Items in MAP and dynamically builds a dependency tree of all Items. By defining the type of invalidation relevant to your Calc Item, you control when and how frequently your Items are updated and re-calculated. The default mode is to invalidate on change of latest calculation time. So, if the latest calculation time of a Raw or Calc Item in the Dependency Tree changes then other Calc Items that are dependent on that Item will automatically recalculate.

What this means in practice is:

  • Step 1. New raw data is uploaded into a Raw Item in an Entity
  • Step 2. All Calc Items that depend on the Raw Item or any child Calc Item are also recalculated
  • Step 3. This all happens in seconds
  •  

    Why use MAP IoT Entities – what are the benefits?

    The key reason is simplicity. They are easy to use, easy to set up and offer a lot of flexibility.

    MAP is an integrated stack so we do all the complicated plumbing required to deliver the calculated metrics you want. So, all a developer needs to consider is:

  • 1. How to upload raw data from their device to MAP (API call or file drop are the best)
  • 2. How to extract data from MAP for use in their application/dashboard/UI (API call is best)
  • That’s it – MAP takes care of everything else!

    What is MAP?

    MAP stands for the Meniscus Analytics Platform and is MAP is our IOT Analytics Platform for delivering solutions at scale and at speed. It is an Integrated Analytics Stack so you can develop your solutions quicker and easier.

    More information on MAP IoT
    More information on MAP

    Lazy loading for processing large data sets

    Introduction

    This is part of a series of articles where we describe the way the Meniscus Analytics Platform (MAP) works. Theses articles jump into the features that make MAP different to other analytics applications by providing an Integrated Analytics Stack delivering real time analytics.

    This article investigate the benefits of lazy loading of data and why this is important in MAP

    What is lazy loading of data?

    Quite simply, it means only loading the part of the data that is required to deliver the information requested. In terms of how MAP works then this principle is used to limit the data input and output from the the underlying MongoDB database into MAP. Whilst this may sound like quite a simple and obvious principle to apply it isn’t always used. Many developers will know the principle when developing dashboard and user interfaces but it is more important when considering the back end database operation.

    Lazy loading is a design pattern commonly used in computer programming to defer initialization of an object until the point at which it is needed. It can contribute to efficiency in the program’s operation if properly and appropriately used. The opposite of lazy loading is eager loading. This makes it ideal in use cases where network content is accessed and initialization times are to be kept at a minimum, such as in the case of web pages.

    Source

    Why is lazy loading relevant in MAP?

    MAP ingests and processes very large volumes of near real time data, specifically data associated with weather. More importantly, MAP holds historic data so that we can deliver historic analytics as used in our MAP Rain solution.

    This means data IO is a key factor in delivering the lighting fast calculation speeds that MAP delivers. So, anything that can improve these IO times is of huge importance to MAP. Lazy loading reduces data volumes extracted and then written back to the database and so improves data IO times.

    About MAP

    MAP is an Integrated Analytics Stack providing a framework for users to create and deploy calculations at scale using any source of raw data. MAP is based on IOT principles and uses Items as the underlying building blocks to store either RAW or CALCulated data. So, users create an Entity Template or Thing using these Items and then replicate this template hundreds of thousands of times using an ItemFactory.

    For more information on MAP then click here

    Support for rich and extensible data types

    Introduction

    This is part of a series of articles where we describe the way the Meniscus Analytics Platform (MAP) works. Theses articles jump into the features that make MAP different to other analytics applications by providing an Integrated Analytics Stack delivering real time analytics. IN this article we talk about extensible data types.

    This article discusses how and why having extensible data types is a real benefit when developing your analytics applications

    Why are extensible data types important?

    Being able to use a wide variety of ‘standard’ data types, but also to create your own, delivers lots of benefits.

    • Provides flexibility. During the import stage you can re-process and store the initial raw data into a ‘pre-processed’ data type. When you want to use this data to deliver a calculation or other use then the data is already configured and available in exactly the format you want
    • Greatly increases data processing and calculation times.
    • Extensible data types give you the ability to control how you store and process your raw data

    Examples of data types supported by MAP

    We have a number of ‘standard’ extensible data types already configured in MAP but there is no limit to the number or variety that you can create.

    • Data Grid. One of the most important for our MAP Rain solution. Processes data in any size of two dimensional grid. Used for radar and forecast rainfall data, satellite imagery and the like
    • Block Grid. Used in conjunction with a Data Grid. Breaks a two dimensional Data Grid into a smaller three dimensional Block. Used for speeding up the processing of Data Grids by ensuring MAP only processes relevant data. See article on lazy loading of data sets
    • Vector Grid. Similar to a Data Grid but provides a two dimensional grid but includes vector and direction data as well. Used for processing grids of forecast wind speed and direction data.
    • Rainfall Location. Holds the location of a point of interest (Latitude and Longitude) as well as the current and historic rainfall data for that Location. Used in MAP Rain
    • Float – standard time series. This is a standard data type for processing time series data. Contains a Date/Time Value pair
    • Journey. Used to create and store a sequence of locations along the route of a journey. We use this data type to predict rainfall along this route using our Hyperlocal rainfall product

    Examples of data types

    About MAP

    MAP is an Integrated Analytics Stack providing a framework for users to create and deploy calculations at scale using any source of raw data. MAP is based on IOT principles and uses Items as the underlying building blocks to store either RAW or CALCulated data. So, users create an Entity Template or Thing using these Items and then replicate this template hundreds of thousands of times using an ItemFactory.

    For more information on MAP then click here

    Benefits of a dynamically constructed dependency tree

    Introduction

    This is part of a series of articles where we describe the way the Meniscus Analytics Platform (MAP) works. Theses articles jump into the features that make MAP different to other analytics applications by providing an Integrated Analytics Stack delivering real time analytics. This article discusses the benefits of a dynamically constructed dependency tree.

    What is a dynamic dependency tree?

    A dependency tree is a list or tree of the way that any Item links to other Items. We use this to manage and understand which Items are required when calculating another Item. So, if Item 1 requires Item 3 and Item 2004 to calculate then any change in Item 3 or Item 2004 will place Item 1 on the calculation queue to be recalculated. The process of managing the Items placed on the queue is critical to MAP and we have a separate Invalidator module specifically to do this.

    While our old MCE analytics platform held a dependency tree it was not dynamic and so, not really a scalable solution. MAP uses a dynamic dependency tree so that as new Items are added then MAP automatically creates its own tree by learning from the calculations as they run. This in turn means that MAP is scalable and can run on any size of database.

    Benefits of using a dependency tree

    • Calculation speed. By knowing the relation between each and every Item ensures MAP processes data in the most optimal way possible. This is turn helps to ensure MAP can deliver lightning fast calculation speeds
    • Automated. Being an automated process means that a developer can just leave MAP to get on and do it’s own ‘thing’ whilst they focus on the critical aspects of developing their application

    About MAP

    MAP is an Integrated Analytics Stack providing a framework for users to create and deploy calculations at scale using any source of raw data. MAP is based on IOT principles and uses Items as the underlying building blocks to store either RAW or CALCulated data. So, users create an Entity Template or Thing using these Items and then replicate this template hundreds of thousands of times using an ItemFactory.

    For more information on MAP then click here

    Using Data Blocks and Data Versioning to deliver real time analytics

    Introduction

    This is part of a series of articles where we describe the way the Meniscus Analytics Platform (MAP) works. Theses articles jump into the features that make MAP different to other analytics applications by providing an Integrated Analytics Stack delivering real time analytics. In this article we discuss Data Blocks and Data Versioning.

    In delivering real time analytics, disk IOPS (Input/output Operations Per Second) is one of the main rate limiting steps in achieving the calculation speeds required when processing high volume and high velocity raw data. An example of such a data is radar rainfall data where new values covering a large area arrive every 5 minutes.

    To help reduce disk IOPS, we developed the concepts of Data Blocks and Data Versioning into MAP to drastically speed up data access, increase calculation speed and reduce the volume of data written back to the database.

    Data Blocks

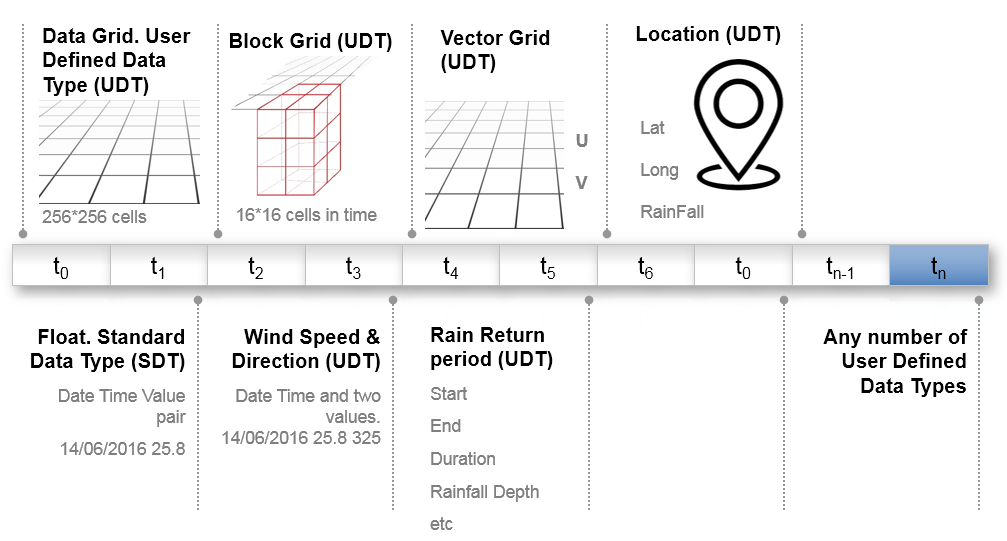
    Rather than loading and persisting all data for an Item, data can be broken up into chunks called Blocks. So, only the chunks of data that are demanded for a query, or as an input to a calculation, are loaded from the database (i.e. delay loading), and only the chunks of data that actually change need to be persisted. Blocks are typically used with unbounded, time-related data such as sample arrays, where the size of a Block is limited and the maximum number of Block samples depends on the size of a sample. This provides efficiencies in real-time processing, whereby data changes are localised and typically at the end of the data.

    Data Blocks are transparent to the user. It is purely an internal mechanism to reduce traffic to/from the database. When requested or persisted, Data Blocks are held in memory for a time. This ensures future retrieval is temporarily faster as the data is expected to be in demand.

    Data Versioning

    Data Blocks are complimented by the MAP concept of Data Versioning. All Item data in MAP is versioned, including Blocks (as such referred to as child data). A version is simply a unique timestamp. It allows users to query for the relative age of data. Specifically, when it last changed, and for calculated Items when the last calculation started and completed. A client application can then tell if data has changed without having to load the data itself. There are additional non-data versions on an Item. I.E when its properties or list of child items last changed.

    It is this versioning technique that allows MAP to efficiently detect when calculated items need recalculating (referred to as dirtying as calculation).

    About MAP

    MAP is an Integrated Analytics Stack providing a framework for users to create and deploy calculations at scale using any source of raw data. MAP is based on IOT principles and uses Items as the underlying building blocks to store either RAW or CALCulated data. So, users create an Entity Template or Thing using these Items and then replicate this template hundreds of thousands of times using an ItemFactory.

    For more information on MAP then click here