Leakage hackathon and MAP IoT
For their leakage hackathon in May 2018, Yorkshire Water released a year of 15 minute water flow data from some 2,170 District Metering Areas (DMA’s) as well as some information on property types and counts in each DMA. All these DMAs were attributed to one of 20 Operating Areas.
The event was managed by the folks at the ODI Leeds and run over the course of two days. Teams were formed from a range of companies with the task of finding new ways to investigate and analyse the data using a range of Big Data analytics.
Meniscus teamed up with colleagues from the RPS Group, Jumping Rivers and the Ordnance Survey to deliver a working leakage analysis prototype using the Internet of Things (IoT) capability of the Meniscus Analytics Platform(MAP).
Additional information:
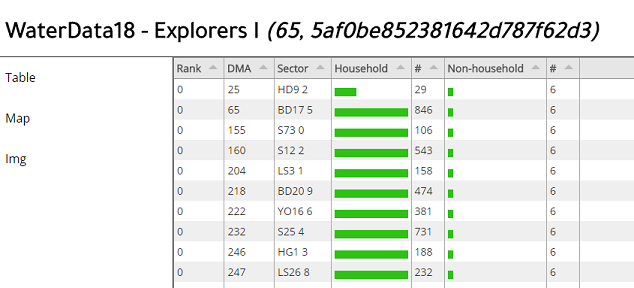
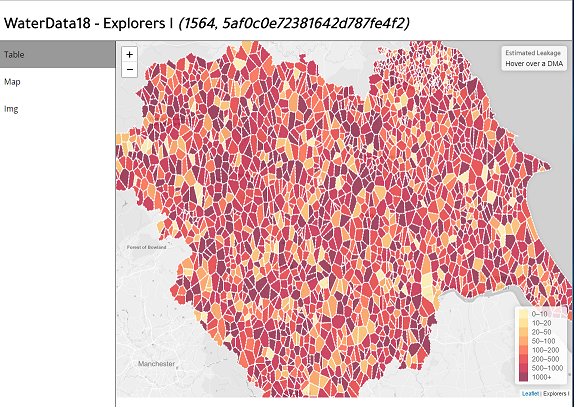
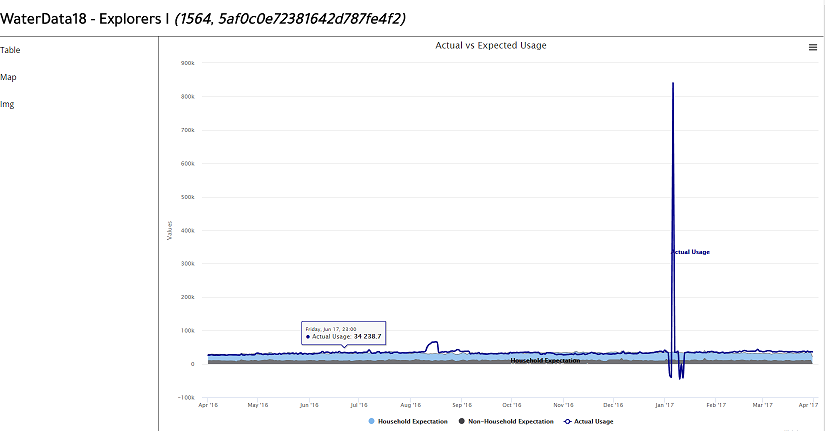
Actual leakage dashboard – delivered in 2 days….this is a prototype and required a lot more work but demonstrates the principles
MAP RAIN
MAP SEWER
MAP IoT
How we developed the solution using MAP
Creating a team, coming up with an idea, developing and then delivering this idea within a two day period was always going to be a difficult feat – but with the excellent team that we had by the end of day two we had a working prototype which clearly requires more work but delivered the following key features:
- A working dashboard displaying the actual baseline against an estimated baseline consumption for each DMA
- Dashboard ranked the DMA’s according to the greatest difference between the calculated and the estimated
- The actual baseline was derived between a start and end time set for the parent Operating Area so that the calculated baseline could be recalculated within minutes for one – or for all the DMAs
- The estimated baseline was derived for each DMA based upon a derived set of lookups
- For each DMA a set of other metrics were calculated, including:
- Total consumption
- Baseline consumption
- Night time and Day time consumption
- Day/Night ratio
- Estimate of the leakage based on the difference between the calculated and the estimated baseline consumption
-
For each Operating Area MAP aggregated the underlying DMA data into a set of aggregated metrics, including
- Average consumption
- Total consumption
- Baseline consumption
- Day and Night consumption
- Day/Night ratio
- Total household and Total Non household demand
-
In order to deliver this we completed the following tasks in MAP:
- Identified DMAs with little to no commercial/industrial properties and DMAs having few residential properties
- Used these DMA to define the average profile for a residential and a commercial customer – customer Profiles
- Set these Profiles up in MAP so that each DMA could use them as a centralised source of data
- Created randomised Voronoi polygon shapes as representations of the DMA areas (the location of the DMA’s was not provided to the teams).
- Create a template in MAP for the Operating Area polygons. This includes all variables we want to use and the associated calculations. Variables included the baseline start and end times and the night time start and end times.
- Create a template in MAP for the DMA data including the property counts, some key variables and the relevant calculations
MAP Templates
MAP templates allow users to create their own calculations and variables in MAP. Once you have set up your initial template and checked the calculations etc then you can replicate the template to thousands….hundreds of thousands of Things or Entities. Everything is created through the MAP browser based web client.
To replicate the template you create a CSV file including all the variables, the names of your Entities and any properties that you want. Include the full path name of the template you wish to use and then import the CSV using the MAP web client.
MAP imports the Entities and applies them to the template which creates all the data structure and associated calculations. Once the Entities are created its just a matter of adding the raw data, historic or real time, and MAP starts calculating everything in the background.


