New makeover for the original MCE Analytics Engine!

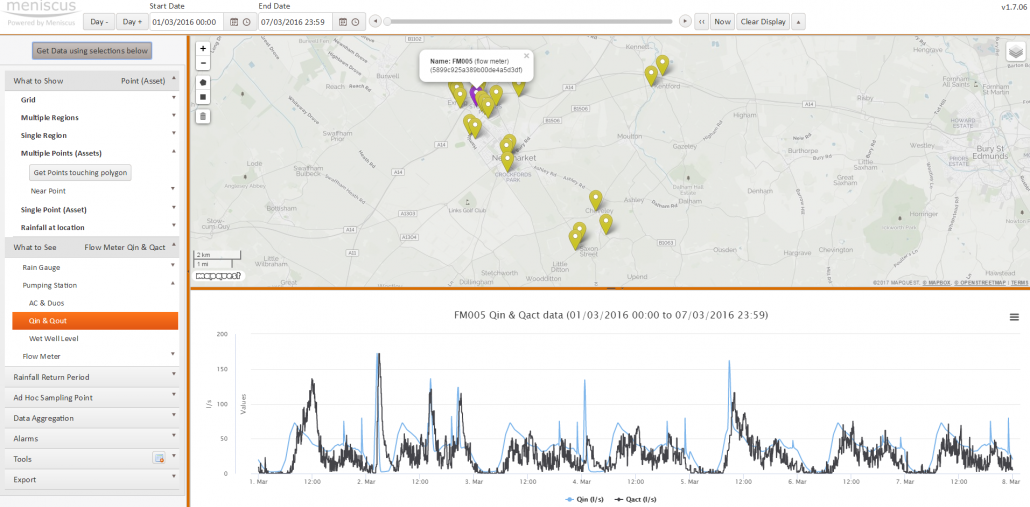
Our original MCE analytics engine has had a bit of a makeover! A new AngularJS webclient and updated Javascript widgets have revitalised the analytics engine. It is just as fast, just as flexible and just as easy to use. However, the new AngularJS dashboard makes it much easier to set up, configure and modify Items. The new Javascript widgets also make it easier to create your own dashboards and to display the metrics you need.

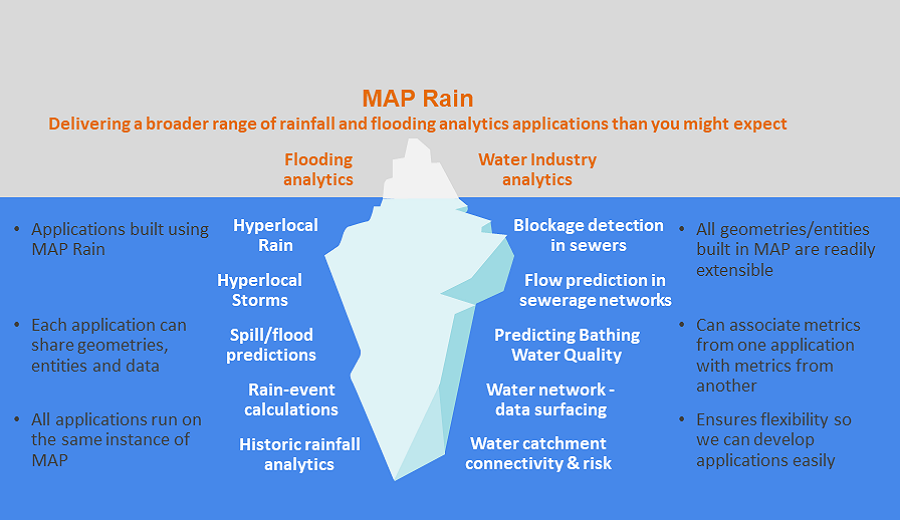
MAP Rain model infographic

MAP Rain model infographic shows some of the analytics solutions built using the MAP Rain model

MAP Rain is a generic real-time model built using MAP for processing, primarily, radar and forecast rainfall data. The model delivers all the underlying process of fusing the historic, current, Hyperlocal (our own 1-hour forecast) and forecast rainfall data together for any area, resolution, or size of cutout (the area over which we process the rainfall data). Built into MAP Rain are lots of methods to re-sample, aggregate, extract and re-process the rainfall data. These ensure we have the flexibility to apply rainfall data to any point or polygon in the overall cutout area. All these methods are available as API calls.

We use MAP Rain to build a broad range of applications that have rainfall data at their heart. The number of such applications continues to rise and we can deliver all these applications to multiple customers on one instance of MAP.

MAP Rain Infographic

More information on MAP Rain

MAP Rain selected as finalist for Wessex Water EDM monitoring Proof of Concept

MAP Rain uses Machine learning for EDM monitoring to identify blockages and reduce the number of alerts generated from CSOs during wet weather

Meniscus are really pleased to be selected for the Wessex Water Proof of Concept looking at making smarter use of EDM monitoring data. MAP Rain has been chosen as one of three solutions to be trialed during the 3 month Proof of Concept. This follows a rigorous review of competition entries from 30 companies.

The trials will run for the next three months and will involve Wessex Water feeding these companies near real-time EDM data to see if they can correctly mute alarms and identify blockages, some of which will be simulated in a controlled environment.

Wessex Water Marketplace and objectives for the challenge

Strategic technology planning manager Jody Knight hopes to see a multitude of benefits from this data driven approach. These include reductions in blockages and CSO spills to alleviate impact on the environment, and lower volumes of alarms during rainfall periods, which will allow staff to work more efficiently and improve their reporting efficiency.

“The Marketplace approach has challenged the normal procurement channels for these emerging technical and data-related problems we encounter with our sewer network,” explained Jody.
“We have managed to communicate the problem to a wider supplier base and received proposals from companies that we may not have normally reached.

“The number of potentially viable and different solutions proposed by the companies in this challenge is encouraging to see as we move toward becoming a more data-centric business and we are grateful for all who have taken part in this challenge.”

Wessex Water launched its Marketplace in 2019 as a first-of-its-kind model for the water industry to increase collaboration with companies both in and out of its usual supply chain.

The online platform shares real data for each challenge that is posted and was designed to uncover alternative ways of managing water and waste, outside of the traditional asset-focused approach, leading to a better service and better value for customers.

More information on MAP Rain click here

For more information on the Wessex Water Marketplace click here

MAP Sewer – creation of simplified sewer network models

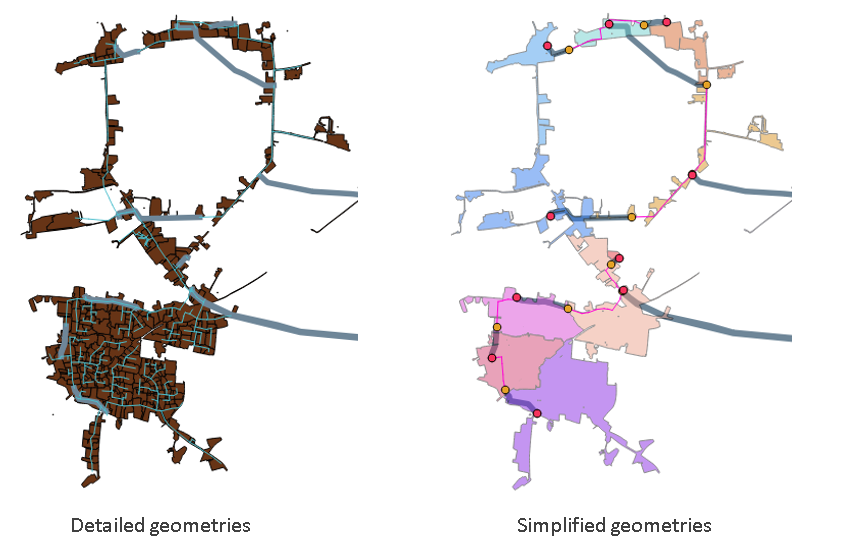
New MAP Sewer capability speeds up the creation of the simplified sewer network models. This makes is quicker and easier to set up our near real time predictive modelling of the sewer network.

We have been working to speed up the creation of the simplified sewer network models in MAP Sewer so that we can rapidly create new models for new catchments. We have now automated the process of creating the main simplified model, and all the relevant geometries, from the detailed GIS layers that make up the ‘standard’ detailed models used by most water companies.

The objective of this work is:

  • Generate the MAP Sewer model inputs from the detailed model
  • To do this in an automated way using a combination of QGIS and PYTHON scripts
  • The methodology includes:

  • Derive location of Pumping Stations, Combined Sewer Overflows, Detention tanks, Weirs and Sluices
  • For each Pumping Station, use QGIS flow trace to identify the upstream conduits
  • Identify the sub-catchments associated to these upstream conduits
  • Dissolve the sub-catchments into one large sub-catchment
  • Aggregate the key sub-catchments properties
  • Calculate the main trunk sewer path and aggregate sewer length, gradient and diameter
  • Create the MAP Sewer nodes
  • The process takes several hours to run and the outputs are:

  • MAP Sewer configuration files. These are CSV files for each geometry. I.e. Pumping Stations, Combined Sewer Overflows, Detention tanks, Weirs and Sluices
  • One sub-catchment file containing all the dissolved sub-catchments. this is a KML file
  • Once this is done then we can add some of the pumping attributes to the Pumping Station and Detention Tank geometry files and then load all the files into MAP Sewer from the dashboard. MAP Sewer then creates the geometries in a few minutes and the whole catchment is calculated in 20 minutes – this includes over 2 years of historic data all at 5 minute periodicity. We can now start to validate the model and to feed it with real time and forecast rainfall data.

    Yorkshire Water leakage hackathon – use of MAP IOT

    Overview of the Open Data leakage hackathon run by Yorkshire Water to identify new ways of applying Big Data and analytics solutions to the issue or water leakage

    Predicting Flows in Sewers to Reduce Energy Costs

    MAP Sewer, Sewer Network

    PREDICTING FLOWS AND ENERGY SAVINGS IN SEWER NETWORKS – HUNDREDS OF CATCHMENTS IN REAL TIME

    MAP Rain and MAP Sewer are two real time data analytics solutions that help Water Companies improve quality of service whilst reducing operating costs. MAP Rain lets you integrate historic, current and predicted rainfall analytics into your solutions. MAP Sewer is an add on to MAP Rain to predict flows into pumping stations and sewers. 

    Our solution helps to:
    • Improving operation of the Wastewater Network by predicting hydraulic overload
    • Reducing Future Flood Risk by predicting sewer flooding
    • Reducing Category 1, 2 and 3 Pollution Incidents by predicting flooding in sewers, pumping stations and CSOs
    • Providing historic radar rainfall and Environment Agency rain gauge data for any location or catchment
    • On Demand calculation of rainfall Return Periods (using FEH99 method) for any location
    • Reducing Energy Costs with real time Demand Management to reduce Distribution Time of Use (DUoS) charges

    sewer network

    Helping Water Companies to improve Outcome Delivery Incentives (ODIs) and reduce energy costs using advanced real time analytics

    Meniscus has a comprehensive understanding of the Water Industry and in delivering process based energy, chemical and a range of real time analytics solutions based around integrating real time rainfall data with operational asset information. These case studies demonstrate how MAP is used to predict Bathing Water quality, identifying where CSOs are discharging and sewer levels are high in dry weather conditions, predicting pumping station flows in the sewer network and delivering a range of complex process based energy and chemical monitoring solutions.

    Meniscus provides analytics solutions for over 2,000 water and wastewater treatment assets sites.

    These solutions process a range of different operational datasets from hours run data, flow, chemical tank level, energy and many more. We are delivering these solutions using our core MCE and MAP analytics platforms. These solutions include a range of visualisations in the form of customised dashboards, widgets and scheduled management reports. Both MCE and MAP have comprehensive RESTful APIs so that developers can readily integrate both platforms directly into their own analytic solutions.