Posts

MAP Rain – new forecast alert dashboard

Our new MAP Rain alert dashboard now makes it much easier to keep track of forecast rain alerts for Points and Polygons in your area of interest. The alert dashboard updates every 5 minutes, as new rainfall data arrives, and updates the colour of your Points and Polygons depending on the level of flood risk. The alert dashboard also displays an animation of the forecast rainfall across the UK

The new forecast alert dashboard provides a simple way to see the alert status of your Points and Polygons along with an annimation of the forecast rainfall for the next 36 hours. We have designed this as a simple way to monitor flooding risk 24/7.

For a live demonstration of MAP Rain then click here and set Username and Password both to demo.

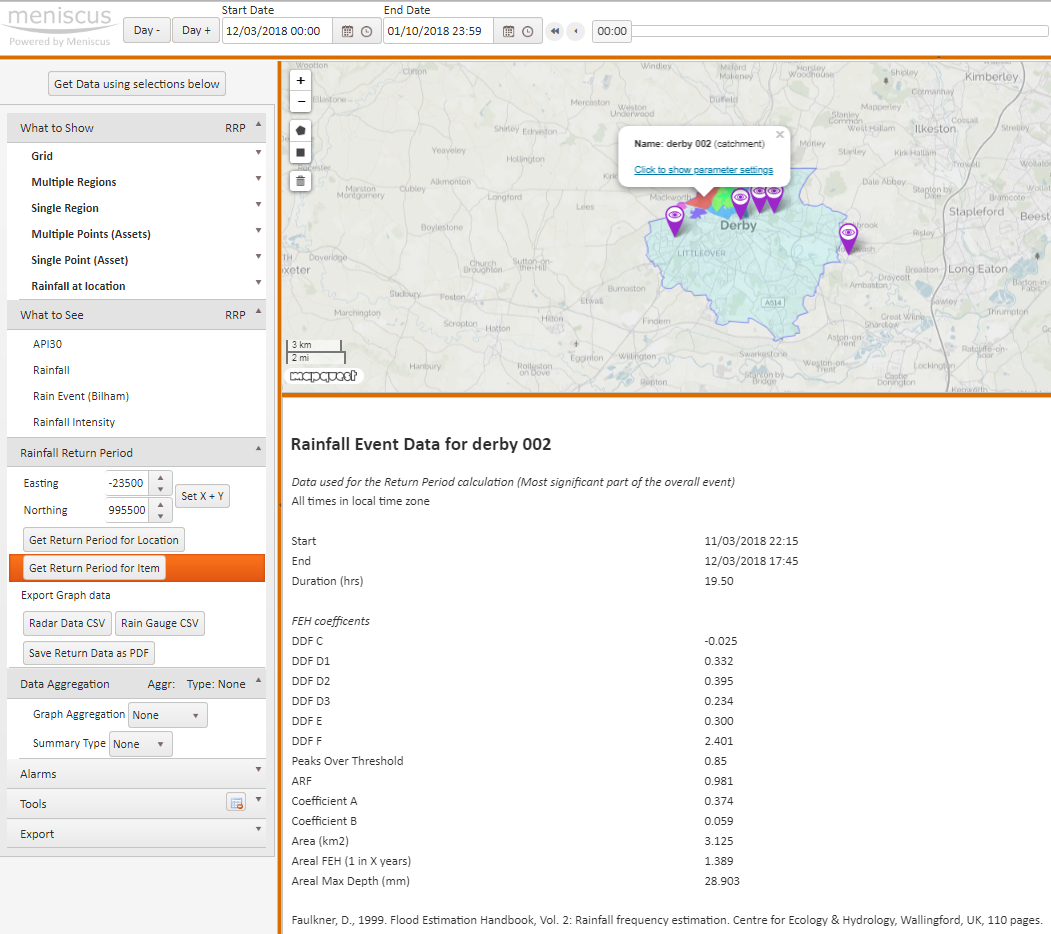
Toggling between current (Query) view and new Alert view

We have added a new button which switches between the existing view of the dashboard and the new Alert view.

New Alert view

The purpose of this new Alert view is to provide customers with a simplified 24/7 view of the rainfall and associated alerts in their area of interest.

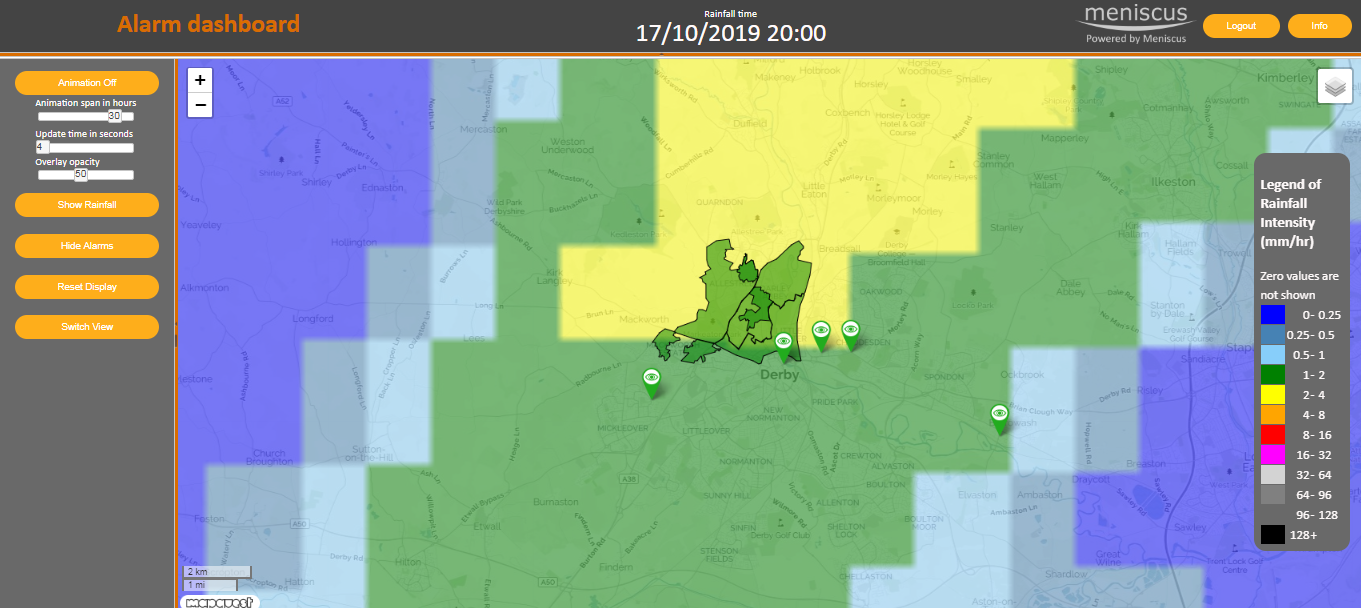
  1. Click on the “Show Alarms” button to see the forecast state of your Points and Polygons
  2. The Alert colour will change as the alert state changes. The Points and Polygons will default to show the green Clear alert
  3. The dashboard refreshes every 5 minute so both the dashboard and the emailed alerts will be synchronised
  4. You can add an animation of the forecast rainfall for the next 36 hours. The animation shows the forecast rainfall for each hour and continuously replays. You can customise the speed of the update, the opacity of the image and the forecast duration
  5. You can stop the animation and use the Show Rainfall button to select historic or forecast rainfall for a particular time using the time slider that will appear. Note: The Points and Polygon alerts will not display historic colour changes, they only show show forecast alerts
  6. The forecast rainfall is displayed for the whole of the UK so you can have a better understanding of the rain that will impact your area of interest.
    Can switch back to the original dashboard view using the “Switch View” button.

MAP Rain – New FEH 2013 Rainfall Return Period calculator

FEH is the industry standard used to estimate local flood risk and develop resilient infrastructure.

New Service – Rainfall Return Period calculation for any location using the FEH 2013 methodology

MAP Rain dashboard and rainfall map now includes the updated FEH (Flood Estimation Handbook) 2013 methodology as well as the original FEH99 method. This provides the Return Period calculation for any location and any date in the past 4 years using the MAP Rain dashboard. These Return Period calculations are available for both Points and Polygons.

You can use the MAP Rain dashboard to calculate:

  • The depth (mm) and duration (hours) of rainfall that generates the largest Return Period on a particular day
  • The depth (mm) of rain for the location that generates a specific Return Period for a specific rainfall duration (hours)
  • For more information on our MAP Rain dashboard and rainfall map click here

    Predicted Rainfall Alerts
    MAP Rain can also apply the FEH 2013 methodology to the forecast rainfall so that we can send you e-mail alerts for any significant rain events that may impact flooding hotspots.

    Return Period calculation API calls

    We have built two API calls into MAP to let you integrate the FEH 2013 return period calculations directly into your own applications. Please note that these call will take about 2 minutes to return.

    Returns depth (mm), duration (hours) and Return Period for a particular day and location

    Inputs

    Date 17th Sept 2017 (rainy day)
    Location in Long Lat (WGS84) or OS Easting and Northing

    Returns

    Rain Event Start and End Time 14:30 to 16:00
    Duration 1.5 hours
    Max Depth 16.68 mm
    Return Period 1 in 2.45 years

    Returns depth of rain (mm) for a specific duration (hours), return period and location

    Inputs

    Location in Long Lat (WGS84) or OS Easting and Northing
    Duration 5 hours
    Return Period 1 in 20 years

    Returns
    Max Depth 47.72 mm

    Acknowledgement

    FEH Return Periods calculated by Meniscus through use of FEH1999 and FEH2013 DDF model © and Database right NERC (CEH).

    Stewart, E. J.; Jones, D. A.; Svensson, C.; Morris, D. G.; Dempsey, P.; Dent, J. E.; Collier, C. G.; Anderson, C. A.. 2013 Reservoir Safety – Long Return Period Rainfall. Project FD2613 WS 194/2/39 Technical Report (two volumes). Joint Defra/Environment Agency Flood and Coastal Erosion Risk Management R&D Programme.

    Areal FEH 99 Return Period calculation for polygons

    As part of our aim of continuing to add complex rainfall analytics into MAP Rain we have added the Areal FEH 99 return period calculation that lets you create the areal return period for a polygon – this is the methodology as set out in the Flood Estimation Handbook.

    How to run

  • From the dashboard click on Rainfall Return Period
  • Set the date you are interested in using the top date selector
  • Select the polygon you are interested in
  • Select the “Get Return Period for Item” option under Rainfall Return Period
  • MAP Rain will then calculate the Areal FEH 99 Return Period and display all the coefficients and results in the map results pane along with a graph of the rainfall intensity for 3 days – includes the previous and the next days.

    Click here for more information on MAP Rain