Power Quality Monitoring
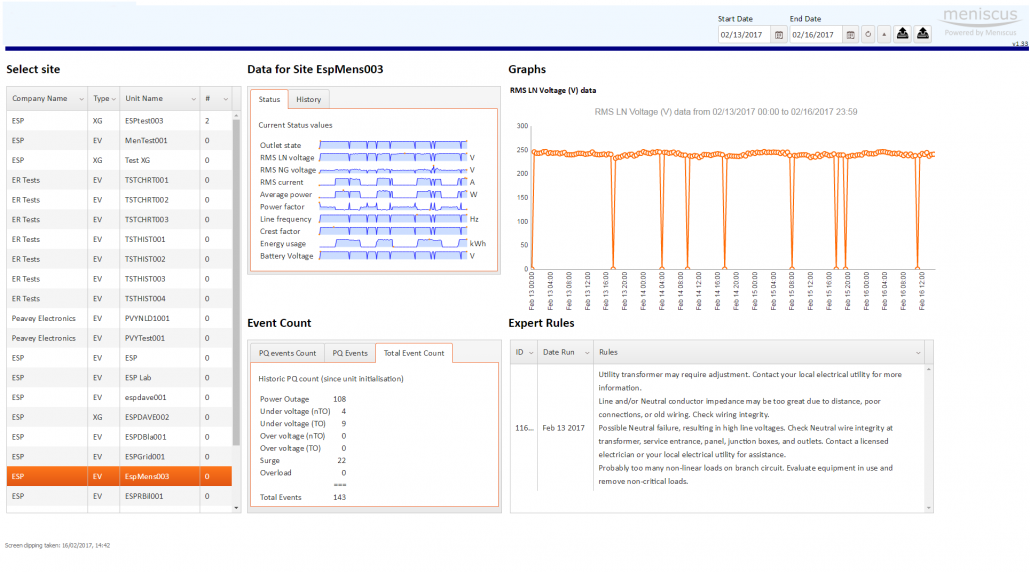
Deployed with a customised dashboard
Objective
To deliver a fully automated power quality monitoring solution. This included data collection, analytics to identify increases and decreases in trends and a rule based ‘expert system’ to identify problems and suggest solutions. This application was built for a company supplying power monitoring and stabilization systems for commercial office equipment.
Details
Each individual power quality monitoring device uploads a regular stream of binary data to a Listener on the Meniscus server. This Listener parses the binary stream and imports the data, using a unique identifier, into the appropriate Entity. If the unique identifier isn’t recognised then the system automatically creates a new Entity in the database and creates all the associated Items and calculations. This ensures there is no work required to set up the backend for a new power quality monitoring device.
Rule based ‘expert system’ scripts are run at regular intervals across all Entities to identify critical issues and e-mail alerts to users. All this information and appropriate trends and power monitoring event information are displayed on a custom built tablet friendly dashboard.
Benefits of using MAP
This application was built using the Meniscus Analytics Platform (MAP) which ensure that the core calculations that underpin the ‘expert rules’ system can easily be updated. The visibility of the calculations in MAP simplifies and speeds up the set up process and simplifies testing. By pre-processing all the calculations as data is received ensures that the run time for the expert scripts is dramatically reduced. So, tests can be run more frequently without impact on the server performance.


