UK map of consented discharges to rivers and groundwater

MAP of consented discharges to rivers – beta version

Overview

We have created a map showing the location and details of all consented discharges to rivers and groundwater for England. We are planning to extend this to both Wales and Scotland if we can obtain the consent data in a suitable format from Natural Resources Wales and SEPA.

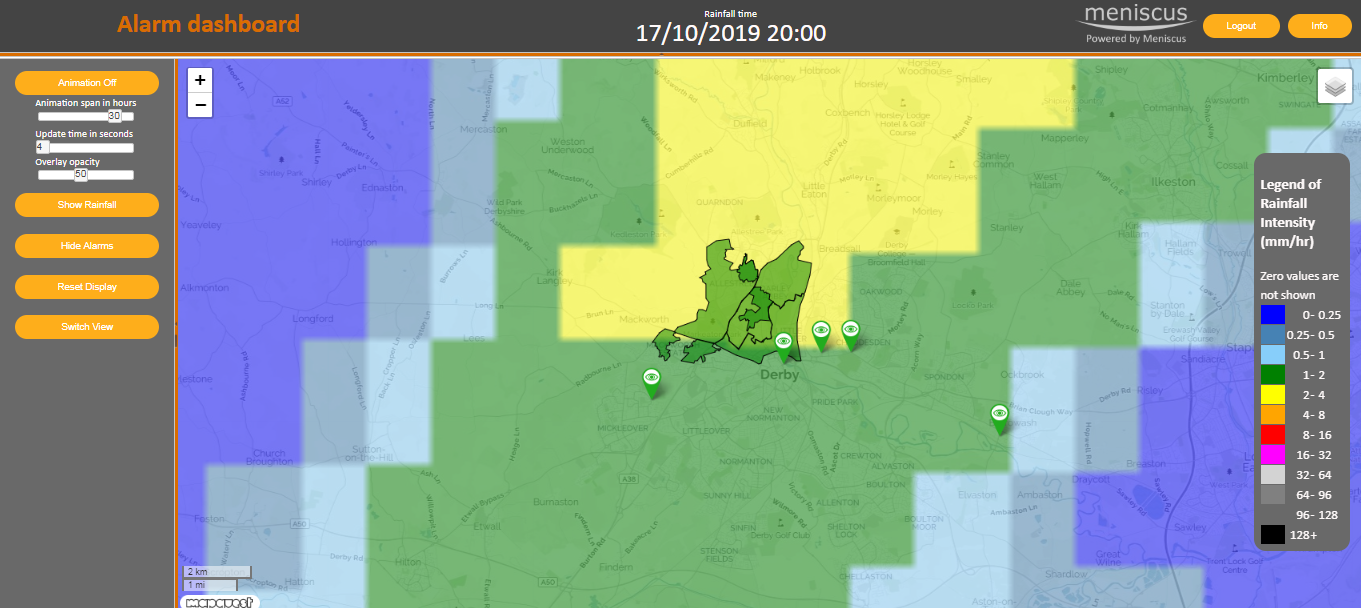
The map shows all main UK rivers and the location of any consented discharge to both rivers and groundwater. Also included are the locations of all Combined Sewer Overflows (black icon) in England. For all consents (orange icon) where the discharge is to river, then we have added the expected location of the consented discharge into the river (blue icon at the end of a green line).

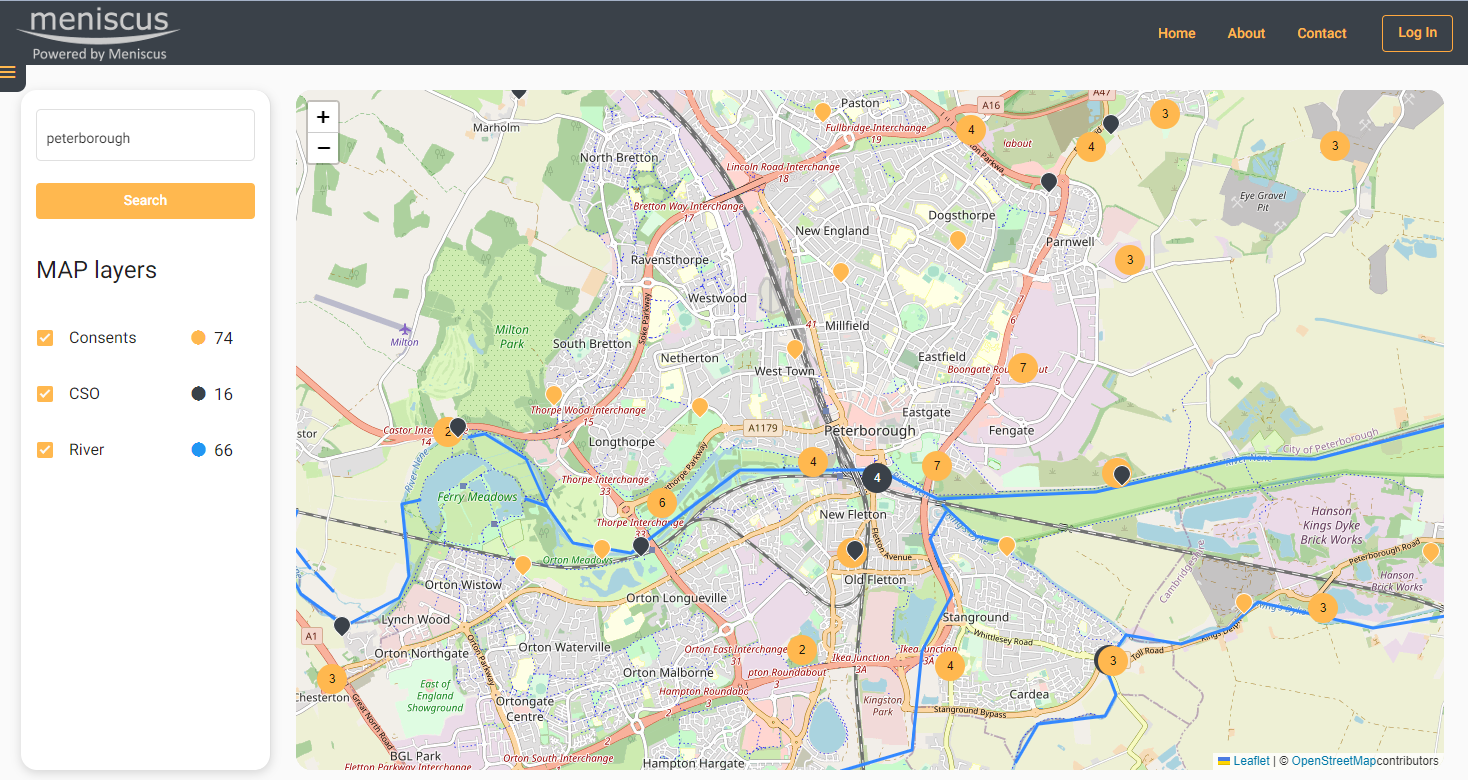
Consents to discharge near peterborough

The map will use your current location (subject to you granting access) to display relevant data. For access on a mobile phone then the area you can view is limited to ensure the site loads quickly. On a PC then you can access a larger area.

Purpose

The idea for the site arose during the Big Rivers challenge at the Northumbrian Water Innovation festival. Meniscus were part of a team, including Meniscus, ESRI and NWL employees to develop a prototype app for Open Water swimmers to understand risk from pollution events. Whilst a lot of the data to deliver such an app is currently not available as a public dataset, we have created this dashboard as a first step to allow river users to identify discharges into rivers.

Information your would like to see

Please let us know if there is additional information that you would like us to try and include in the map. We cannot promise to make changes but we will always look to see what can be done.

Contact us at [email protected] or through our contact page

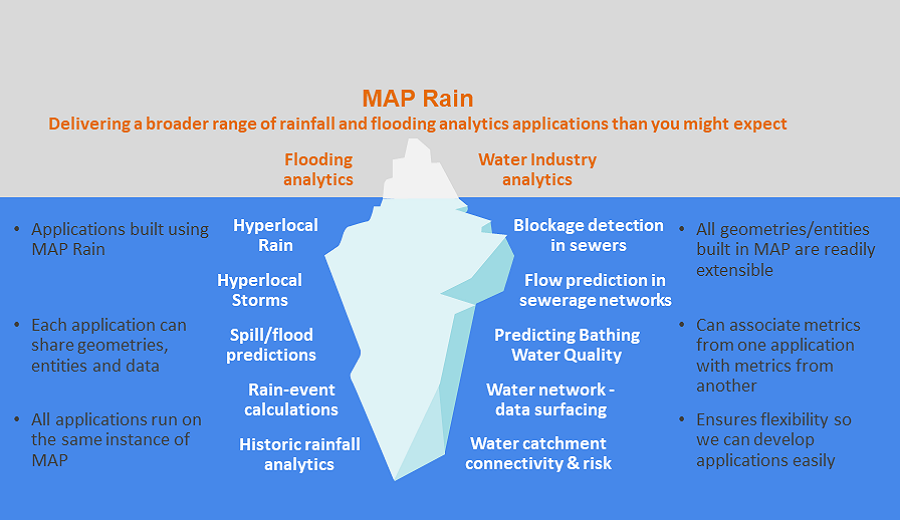
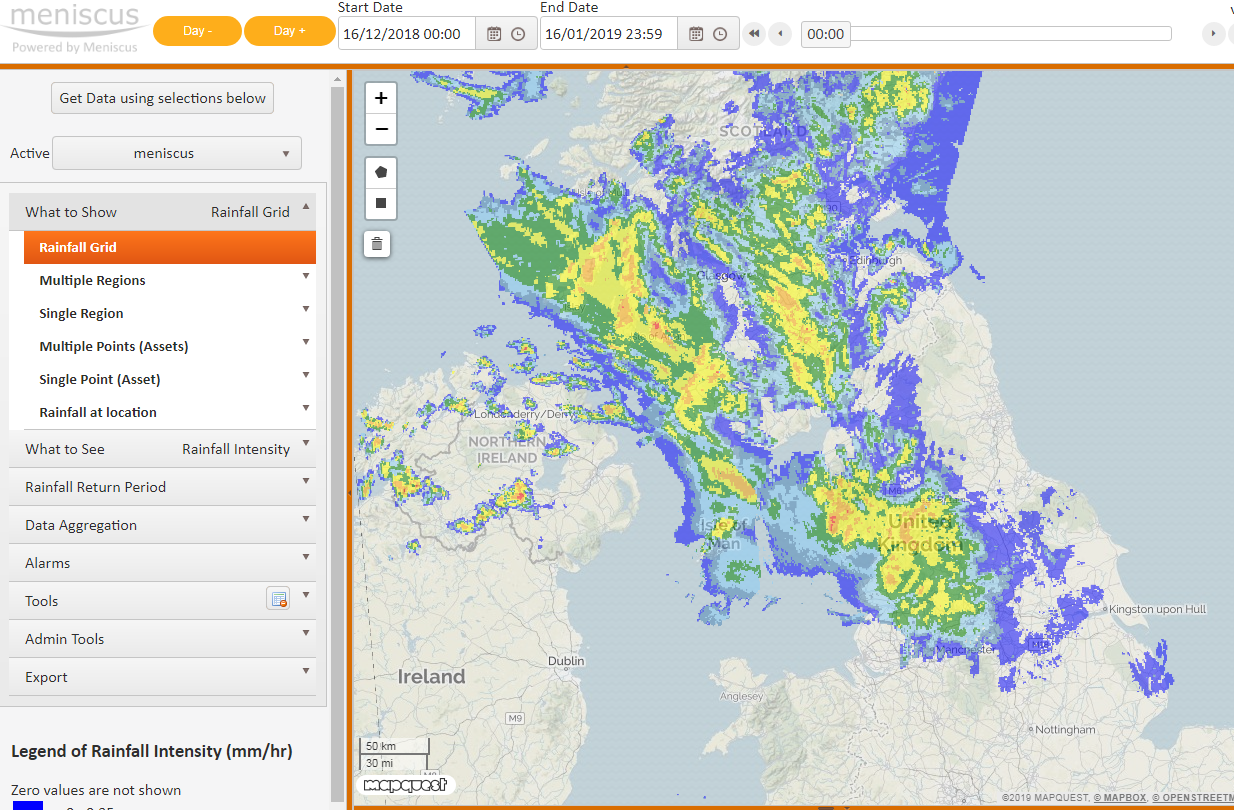
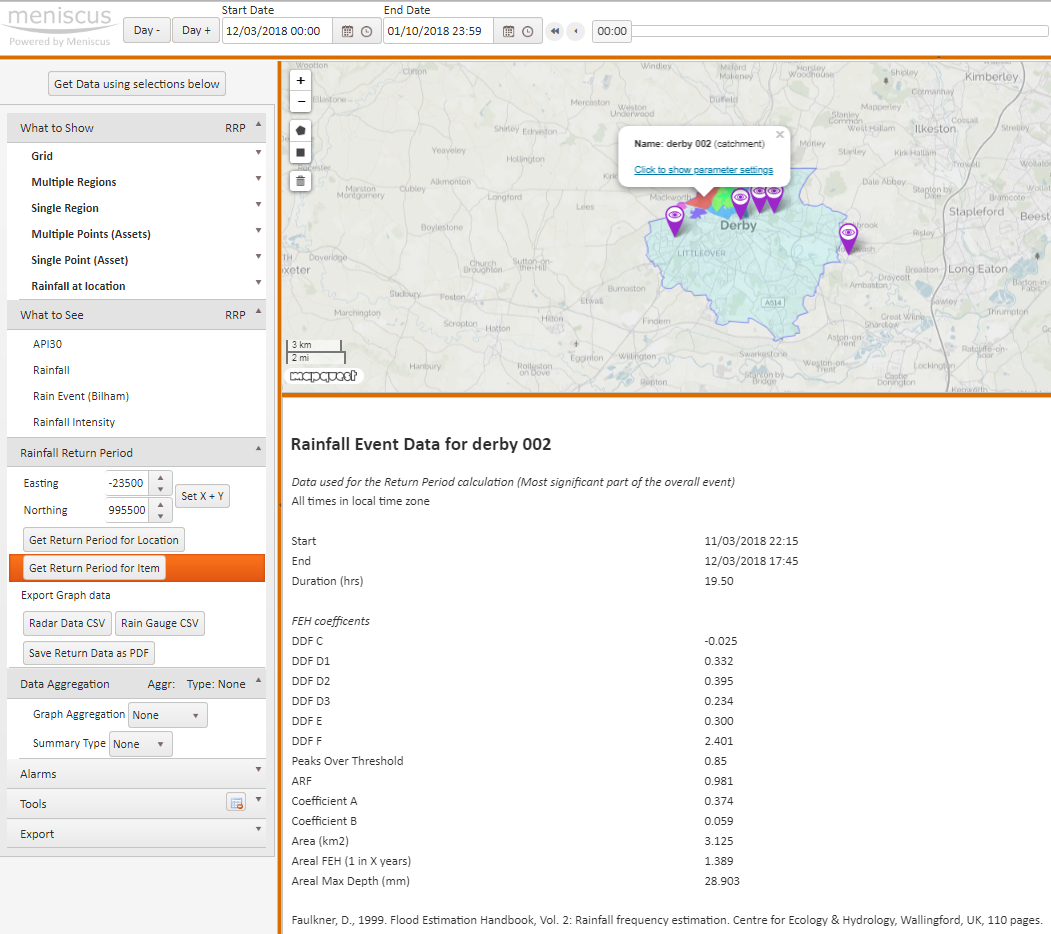
Background on MAP Rain

More information on MAP Rain click here

MAP Rain model infographic

MAP Rain model infographic shows some of the analytics solutions built using the MAP Rain model

MAP Rain is a generic real-time model built using MAP for processing, primarily, radar and forecast rainfall data. The model delivers all the underlying process of fusing the historic, current, Hyperlocal (our own 1-hour forecast) and forecast rainfall data together for any area, resolution, or size of cutout (the area over which we process the rainfall data). Built into MAP Rain are lots of methods to re-sample, aggregate, extract and re-process the rainfall data. These ensure we have the flexibility to apply rainfall data to any point or polygon in the overall cutout area. All these methods are available as API calls.

We use MAP Rain to build a broad range of applications that have rainfall data at their heart. The number of such applications continues to rise and we can deliver all these applications to multiple customers on one instance of MAP.

MAP Rain Infographic

More information on MAP Rain

Current Hyperlocal Storm alerts

These are the Hyperlocal Storms alerts (beta) identified around the UK for today. Using real-time radar rainfall we are tracking the path of areas of high-intensity rainfall and predicting their movement over the next hour, at 5-minute increments, using a machine learning algorithm. As these Hyperlocal Storms pass over any village, town or city we generate an alert. For customers interested in particular cities then we can create the alerts for any postcode sector in the city.

This is part of our MAP Rain service. For more information then click here.

We have created our own Hyperlocal Rainfall predictions for the past 5 years. Click here for more information and you can download the Hyperlocal Rainfall app on both the Google Playstore and the Apple App Store.

Hyperlocal Storm – predicting high intensity storms at any location

Hyperlocal Storm

Hyperlocal Storm tracks high-intensity rainfall, in near real-time, and predicts the movement of the storm for the next hour at 5-minute intervals.

We then overlay this information with a map of all urban extents in the UK to identify ANY village/town that will be affected. For major urban areas, we are generating alerts at the postcode sector level.

This service will be of particular interest to Councils and Companies covering large rural areas or having large numbers of locations dotted around the country.

The image below shows an example of the urban extents and postcode sectors around the Leeds area.

Example of urban extents around the Leeds area

Why is this different – what is the benefit?

At present, using our MAP Rain point or polygon alerts, we identify rain events happening over the next 30 hours using forecast data. But, we need to know the location of that point or polygon.

With Hyperlocal Storm, we can identify any area at risk, without having to set that area up beforehand. So, for large rural areas, like Lincolnshire, we can predict these storms for any urban area across the 20,000+ km2 council area.

Next steps?

We are finalising testing at the moment and trying to work out the best way to visualise this information and/or share it with partners. This is where we need some help. We are keen to understand how users might want to use this information and share it within their organisations or with residents.

More information on MAP Rain click here

MAP Rain case study – Leeds City Council and storm Ciara

Case Study overview

Leeds City Council use MAP Rain to analyse historic rain events and to receive forecast rain alerts. This is a summary of the alerts generated for storm Ciara on the 9th and 10th February 2020 and compares actual rainfall against the alerts generated.

MAP Rain supports different type of rainfall alerts. The alerts for Leeds include:

  • Forecast rainfall alert (mm/hr). Generated when the forecast rainfall exceeds a threshold value
  • Current rainfall alert (mm/hr). Generated when the actual rainfall exceeds a threshold value
  • FEH rainfall alert (1 in X years). Generated when the FEH Return period alert exceeds a threshold value
  • MAP Rain constantly reviews and calculates these alerts every 5 minutes as new radar and forecast rainfall data is received. E-mails are sent to the Flood Management team according to a set of rules designed to limit the number of e-mails sent.

    Over the last two years, the Leeds City Council Flood Management team have been very pro-active in reviewing and adjusting these threshold values in light of historic flooding events. They have also adjusted the location of the monitoring points to correlate them more precisely to locations at risk.

    Quote from John Bleakley Group Engineer (Investigations) on the 18th Feb 2020.

    “One of the big successes from a surface water flooding impacts perspective (not river) for me was Meniscus after lots of tweaking. For Ciara we had hundreds of Meniscus warnings and they were pretty much spot on from where I sit, which means we can galvanise our efforts in those areas with more confidence in the future, contrast storm Dennis a week later, there were hardly any Meniscus rainfall alerts for our district which again, was borne out in reality by no flooding impacts in the Leeds District.”

    Actual rainfall depth – issued by Leeds City Council flood team on the 10th February

    The choropleth map shown below was created by the Leeds City Council flood team the day after the event using data from MAP Rain. The image was tweeted to residents the day after the storm and is a great example of the use of maps to communicate the location and depth of the rainfall that affected the community.

    MAP Rain FEH rain event Alerts

    For storm Ciara, MAP Rain generated alerts for 5 catchments and 18 monitoring points. These alerts were e-mailed to Leeds City Council and latest alert status was displayed on the MAP Rain dashboard.

    Alerts for the monitoring points were generated earlier than the catchment alerts and also changed more frequently. This is a consequence of the inherent averaging associated with the catchment alerts. The catchments aggregate the rainfall for all the underlying rainfall cells and this averaging, or smoothing, means they react slower to changes in the forecast rainfall.

    The two images below display the results for the first FEH Alerts generated for the storm. The left-hand image shows the first catchment alerts (shown in yellow). The right-hand image shows the first point-based alerts with their corresponding colour coded legend. The numbers are the calculated FEH rain event predicted for the catchment or point.

    The first monitoring point alerts were generated at approximately 09:45 on the 8th February with the majority generated from about 20:00 on the 8th, some 4-5 hours before the start of the heavy rain.

    The first catchment-based alerts were created later at about midday on the 9th February.

    Click here for more information on MAP Rain

    MAP Rain – new forecast alert dashboard

    Our new MAP Rain alert dashboard now makes it much easier to keep track of forecast rain alerts for Points and Polygons in your area of interest. The alert dashboard updates every 5 minutes, as new rainfall data arrives, and updates the colour of your Points and Polygons depending on the level of flood risk. The alert dashboard also displays an animation of the forecast rainfall across the UK

    The new forecast alert dashboard provides a simple way to see the alert status of your Points and Polygons along with an annimation of the forecast rainfall for the next 36 hours. We have designed this as a simple way to monitor flooding risk 24/7.

    For a live demonstration of MAP Rain then click here and set Username and Password both to demo.

    Toggling between current (Query) view and new Alert view

    We have added a new button which switches between the existing view of the dashboard and the new Alert view.

    New Alert view

    The purpose of this new Alert view is to provide customers with a simplified 24/7 view of the rainfall and associated alerts in their area of interest.

    1. Click on the “Show Alarms” button to see the forecast state of your Points and Polygons
    2. The Alert colour will change as the alert state changes. The Points and Polygons will default to show the green Clear alert
    3. The dashboard refreshes every 5 minute so both the dashboard and the emailed alerts will be synchronised
    4. You can add an animation of the forecast rainfall for the next 36 hours. The animation shows the forecast rainfall for each hour and continuously replays. You can customise the speed of the update, the opacity of the image and the forecast duration
    5. You can stop the animation and use the Show Rainfall button to select historic or forecast rainfall for a particular time using the time slider that will appear. Note: The Points and Polygon alerts will not display historic colour changes, they only show show forecast alerts
    6. The forecast rainfall is displayed for the whole of the UK so you can have a better understanding of the rain that will impact your area of interest.
      Can switch back to the original dashboard view using the “Switch View” button.

    MAP Rain – New FEH 2013 Rainfall Return Period calculator

    FEH is the industry standard used to estimate local flood risk and develop resilient infrastructure.

    New Service – Rainfall Return Period calculation for any location using the FEH 2013 methodology

    MAP Rain dashboard and rainfall map now includes the updated FEH (Flood Estimation Handbook) 2013 methodology as well as the original FEH99 method. This provides the Return Period calculation for any location and any date in the past 4 years using the MAP Rain dashboard. These Return Period calculations are available for both Points and Polygons.

    You can use the MAP Rain dashboard to calculate:

  • The depth (mm) and duration (hours) of rainfall that generates the largest Return Period on a particular day
  • The depth (mm) of rain for the location that generates a specific Return Period for a specific rainfall duration (hours)
  • For more information on our MAP Rain dashboard and rainfall map click here

    Predicted Rainfall Alerts
    MAP Rain can also apply the FEH 2013 methodology to the forecast rainfall so that we can send you e-mail alerts for any significant rain events that may impact flooding hotspots.

    Return Period calculation API calls

    We have built two API calls into MAP to let you integrate the FEH 2013 return period calculations directly into your own applications. Please note that these call will take about 2 minutes to return.

    Returns depth (mm), duration (hours) and Return Period for a particular day and location

    Inputs

    Date 17th Sept 2017 (rainy day)
    Location in Long Lat (WGS84) or OS Easting and Northing

    Returns

    Rain Event Start and End Time 14:30 to 16:00
    Duration 1.5 hours
    Max Depth 16.68 mm
    Return Period 1 in 2.45 years

    Returns depth of rain (mm) for a specific duration (hours), return period and location

    Inputs

    Location in Long Lat (WGS84) or OS Easting and Northing
    Duration 5 hours
    Return Period 1 in 20 years

    Returns
    Max Depth 47.72 mm

    Acknowledgement

    FEH Return Periods calculated by Meniscus through use of FEH1999 and FEH2013 DDF model © and Database right NERC (CEH).

    Stewart, E. J.; Jones, D. A.; Svensson, C.; Morris, D. G.; Dempsey, P.; Dent, J. E.; Collier, C. G.; Anderson, C. A.. 2013 Reservoir Safety – Long Return Period Rainfall. Project FD2613 WS 194/2/39 Technical Report (two volumes). Joint Defra/Environment Agency Flood and Coastal Erosion Risk Management R&D Programme.

    MAP Rain – rainfall map and analytics for urban areas

    We are pleased to announce the introduction of a new geometry in MAP RAIN that delivers big cost reductions. This is ideal for large rural agencies who want a rainfall map and rainfall analytics data for their urban areas.

    A new Multi-Polygon geometry delivers a rainfall map for just the areas that area of specific interest to you. Before this, we had to provide rainfall and associated data for the whole area of interest.

    Click here for more information on MAP Rain and rainfall map

  • Example: A Lead Flood Authority with a large predominately rural area of say 10,000km2 only wants real time and predictive rainfall analytics and access to FEH data for the urban areas, say 750km2. Previously, we had to provide rainfall data for the whole 10,000 km2 area and then add Polygons within this for specific catchments of interest. With the new Multi-Polygon geometry we can provide the customer with these analytics for JUST the urban areas. This delivers a big reduction in the cost of accessing rainfall analytics information from MAP Rain. I.e.MAP Rain prices are based on 750km2 rather than 10,000km2.
  • Example of multi-polygon area

    To receive a quote for using MAP Rain in your are then please send us a message from the Contact Page

    MAP Rain – updated imagery for rainfall map

    We recently updated MAP Rain to display rainfall as an image making it much faster to display new images. Previously we displayed rainfall for each individual 1 km square cell. MAP Rain processes data in km squares using the Ordnance Survey Grid Reference system but the dashboard uses the WGS84 projection. So to produce a suitable image we have to go through several stages.

  • Use the four corners of the visible area of the map and return the min/max Easting and Northings required to fully display the image. We add a small amount to each side to ensure it is covered on the screen.
  • Render an image for these Easting and Northings values from the internal grid that represents the data at the relevant time.
  • Then ‘warp’ this image to change the projection from a flat grid reference to the representation of that grid on the map. This is why the top and bottom of the returned trapezoid are curved and it is wider at the top than the bottom (imagine taking a sheet of paper and placing on a globe). We then display this image on the dashboard.
  • This process allows us to return different ‘zoom’ levels of the image with each having a better resolution. Most other mapping solutions limit the zoom level as they only display the one image for the whole of the UK.

    Click here for more information on MAP Rain and our rainfall map and dashboard

    Areal FEH 99 Return Period calculation for polygons

    As part of our aim of continuing to add complex rainfall analytics into MAP Rain we have added the Areal FEH 99 return period calculation that lets you create the areal return period for a polygon – this is the methodology as set out in the Flood Estimation Handbook.

    How to run

  • From the dashboard click on Rainfall Return Period
  • Set the date you are interested in using the top date selector
  • Select the polygon you are interested in
  • Select the “Get Return Period for Item” option under Rainfall Return Period
  • MAP Rain will then calculate the Areal FEH 99 Return Period and display all the coefficients and results in the map results pane along with a graph of the rainfall intensity for 3 days – includes the previous and the next days.

    Click here for more information on MAP Rain